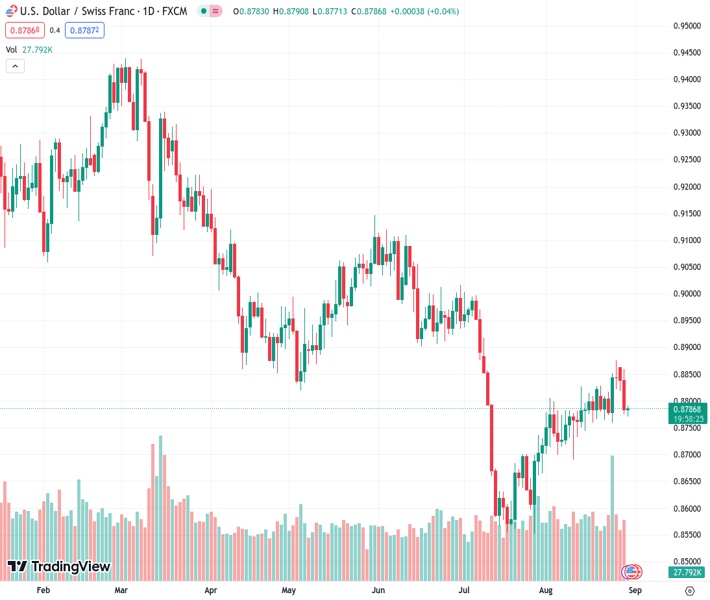
The currency pair USD/CHF experienced a drop from 0.8858 to 0.8770 due to the overall weakness of the US dollar.
…
This is a premium post.
[s2If !current_user_can(access_s2member_level4)]Please register for FREE REGISTER to read full post below containing analysis. In case of any error or you think you are not able to read the full post below, please email us at support#nehcap.com [lwa][/s2If] [s2If current_user_can(access_s2member_level1)]
- USD/CHF slumped from 0.8858 to 0.8770 amid the USD weakness.
The pair currently trades last at 0.87860.
The previous day high was 0.8859 while the previous day low was 0.8775. The daily 38.2% Fib levels comes at 0.8807, expected to provide resistance. Similarly, the daily 61.8% fib level is at 0.8827, expected to provide resistance.
The USD/CHF pair consolidates its recent loss below the 0.8800 barrier during the early Asian session on Wednesday. The Greenback faces some follow-through selling due to the downbeat US data and a decline in bond yields. Meanwhile, the US Dollar Index (DXY), a measure of the value of USD against six other major currencies, hovers around 103.60 after reaching the bottom of 103.36. At the time of writing, the USD/CHF is trading at 0.8790, gaining 0.07%.
The US dollar is weakening broadly following softer US economic data. On Tuesday, the US Job Openings and Labor Turnover Survey (JOLTS) for July showed the lowest reading since March 2021 by decreasing to 8.827M versus 9.165M prior and against the 9.465M expected. Meanwhile, the Conference Board’s (CB) Consumer Confidence Index for August fell to 106.10 from 114.00 in July, below the market expectation of 116.0. The S&P/Case-Shiller Home Price Indices improved to -1.2% YoY versus -1.7% prior and -1.2% estimated.
That said, Federal Reserve (Fed) Chairman Jerome Powell left the door open for a potential additional rate hike. However, it would depend on incoming data. The condition of the labor market may influence the USD’s short-term direction. Market participants are awaiting the release of US employment data later this week, which could spark market volatility. The market anticipated that the Fed will push back rate hikes until the September meeting. According to the CME’s FedWatch Tool, markets are pricing in a 16% chance of a rate hike in the next meeting versus 20% prior. This, in turn, exerts some selling pressure on the USD.
On the other hand, US Commerce Secretary Gina Raimondo emphasized US concerns regarding difficulties operating American companies and national security issues during the visit to Beijing for four days. Furthermore, the US and China also discussed China’s recent restrictions on gallium and germanium exports during a meeting. The exacerbating tension between the world’s two largest economies should dampen market optimism. This, in turn, might benefit the traditional safe-haven Swiss Franc and act as a headwind for the USD/CHF pair.
Moving on, market players will focus on the Swiss KOF Leading Indicator for August, the ZEW Survey, and the Consumer Price Index YoY. Across the pond, the US ADP private employment and estimate of Q2 Gross Domestic Product (GDP) data will be due on Wednesday, followed by the US inflation data on Thursday and the highly-anticipated Nonfarm Payrolls on Friday. These figures might trigger the volatility in the market and traders will find the trading opportunities around the USD/CHF pair.
Technical Levels: Supports and Resistances
USDCHF currently trading at 0.8788 at the time of writing. Pair opened at 0.8784 and is trading with a change of 0.05 % .
| Overview | Overview.1 | |
|---|---|---|
| 0 | Today last price | 0.8788 |
| 1 | Today Daily Change | 0.0004 |
| 2 | Today Daily Change % | 0.0500 |
| 3 | Today daily open | 0.8784 |
The pair is trading above its 20 Daily moving average @ 0.8785, below its 50 Daily moving average @ 0.8791 , below its 100 Daily moving average @ 0.8885 and below its 200 Daily moving average @ 0.9076
| Trends | Trends.1 | |
|---|---|---|
| 0 | Daily SMA20 | 0.8785 |
| 1 | Daily SMA50 | 0.8791 |
| 2 | Daily SMA100 | 0.8885 |
| 3 | Daily SMA200 | 0.9076 |
The previous day high was 0.8859 while the previous day low was 0.8775. The daily 38.2% Fib levels comes at 0.8807, expected to provide resistance. Similarly, the daily 61.8% fib level is at 0.8827, expected to provide resistance.
Note the levels of interest below:
- Pivot support is noted at 0.8753, 0.8722, 0.8669
- Pivot resistance is noted at 0.8837, 0.889, 0.8921
| Levels | Levels.1 |
|---|---|
| Previous Daily High | 0.8859 |
| Previous Daily Low | 0.8775 |
| Previous Weekly High | 0.8876 |
| Previous Weekly Low | 0.8760 |
| Previous Monthly High | 0.9005 |
| Previous Monthly Low | 0.8552 |
| Daily Fibonacci 38.2% | 0.8807 |
| Daily Fibonacci 61.8% | 0.8827 |
| Daily Pivot Point S1 | 0.8753 |
| Daily Pivot Point S2 | 0.8722 |
| Daily Pivot Point S3 | 0.8669 |
| Daily Pivot Point R1 | 0.8837 |
| Daily Pivot Point R2 | 0.8890 |
| Daily Pivot Point R3 | 0.8921 |
[/s2If]
Download Nehcap EAWe have two EAs that are operational on our LIVE accounts.
- EA-FIX: Check out the details here. Download EA-FIX . EA-FIX is a non-grid HFT scalper.
- EA-GROWTH: High quality low dd EA using trend grids. Download EA_GROWTHJoin Our Telegram Group
")


