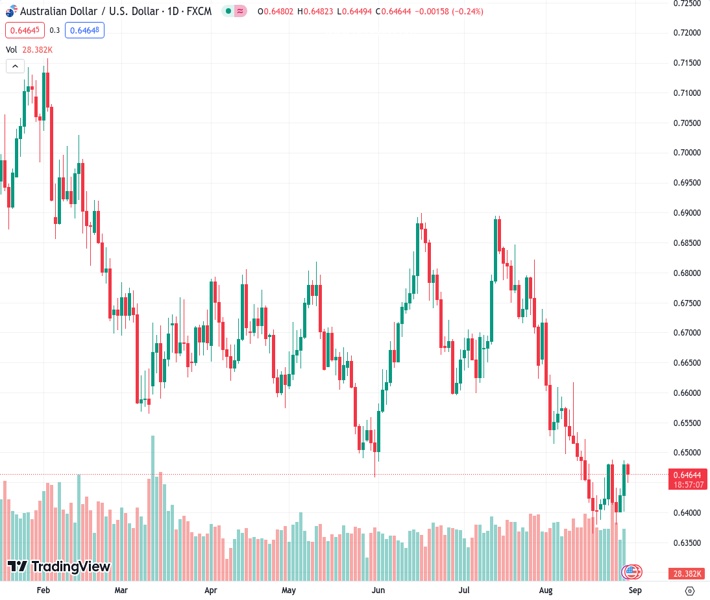
The Australian dollar against the US dollar (AUDUSD) at 0.64637 is experiencing a decrease in demand, causing it to reach a new low during the day. This drop in value ends a two-day period of gains for the currency pair, prompted by disappointing economic data from Australia.
…
This is a premium post.
[s2If !current_user_can(access_s2member_level4)]Please register for FREE REGISTER to read full post below containing analysis. In case of any error or you think you are not able to read the full post below, please email us at support#nehcap.com [lwa][/s2If] [s2If current_user_can(access_s2member_level1)]
- AUD/USD takes offers to refresh intraday low, snaps two-day winning streak on downbeat Australia data.
The pair currently trades last at 0.64637.
The previous day high was 0.6487 while the previous day low was 0.6401. The daily 38.2% Fib levels comes at 0.6454, expected to provide support. Similarly, the daily 61.8% fib level is at 0.6434, expected to provide support.
AUD/USD slides nearly 25 pips to 0.6450 on the downbeat Australia inflation and housing numbers early Wednesday. Adding strength to the pullback moves could be the fresh challenges about the US-China ties and the market’s consolidation of the previous day’s moves against the US Dollar, especially when the top-tier employment, growth and inflation clues are on the calendar.
That said, Australia’s Monthly Consumer Price Index (CPI) flashed the 4.9% YoY figures for July versus 5.2% expected and 5.4% prior while the Building Permits slumps with -8.1% figure for the said month compared to -0.8% market forecasts and -7.7% figures reported in June.
With this, the Aussie statistics challenge the previous day’s hawkish comments from the Reserve Bank of Australia (RBA) Governor-Designate Michelle Bullock. The policymaker conveyed too high inflation as the priority as Governor before flagging hopes of raising rates on Tuesday. However, RBA’s Bullock also showed readings to watch data carefully for further decision-making.
Elsewhere, concerns about China and fears of no easy money from the International Monetary Fund (IMF) also seemed to have prodded the AUD/USD bulls. Recently, China’s embassy in the US defended its cybersecurity review on the US chipmaker Micron by citing national security concerns, especially after US Commerce Secretary Gina Raimondo complained about the hardships for the US firms in China.
Earlier in the day, the IMF showed readiness to be more cautious while allocating the Special Drawing Rights (SDRs) in the future, due to the current environment of higher interest rates and inflation.
Against this backdrop, S&P 500 Futures struggle to extend the three-day uptrend while the US Dollar Index (DXY) remains sidelined around 103.55 after falling the most in six weeks. That said, the US Treasury bond yields remain sidelined at a two-week low.
It should be noted that the downbeat prints of consumer sentiment and employment signals from the US drowned the US Dollar and the yields the previous day and fueled the AUD/USD price towards refreshing the weekly top.
Failure to cross the 21-DMA hurdle surrounding 0.6480 directs the AUD/USD pair towards the six-week-old previous resistance line surrounding 0.6430.
Technical Levels: Supports and Resistances
AUDUSD currently trading at 0.6472 at the time of writing. Pair opened at 0.648 and is trading with a change of -0.12% % .
| Overview | Overview.1 | |
|---|---|---|
| 0 | Today last price | 0.6472 |
| 1 | Today Daily Change | -0.0008 |
| 2 | Today Daily Change % | -0.12% |
| 3 | Today daily open | 0.648 |
The pair remains strongly bearish on the daily time frame. It trades below the 20 SMA @ 0.6477, 50 SMA 0.6622, 100 SMA @ 0.6651 and 200 SMA @ 0.6726.
| Trends | Trends.1 | |
|---|---|---|
| 0 | Daily SMA20 | 0.6477 |
| 1 | Daily SMA50 | 0.6622 |
| 2 | Daily SMA100 | 0.6651 |
| 3 | Daily SMA200 | 0.6726 |
The previous day high was 0.6487 while the previous day low was 0.6401. The daily 38.2% Fib levels comes at 0.6454, expected to provide support. Similarly, the daily 61.8% fib level is at 0.6434, expected to provide support.
Note the levels of interest below:
- Pivot support is noted at 0.6425, 0.6371, 0.634
- Pivot resistance is noted at 0.6511, 0.6542, 0.6597
| Levels | Levels.1 |
|---|---|
| Previous Daily High | 0.6487 |
| Previous Daily Low | 0.6401 |
| Previous Weekly High | 0.6488 |
| Previous Weekly Low | 0.6380 |
| Previous Monthly High | 0.6895 |
| Previous Monthly Low | 0.6599 |
| Daily Fibonacci 38.2% | 0.6454 |
| Daily Fibonacci 61.8% | 0.6434 |
| Daily Pivot Point S1 | 0.6425 |
| Daily Pivot Point S2 | 0.6371 |
| Daily Pivot Point S3 | 0.6340 |
| Daily Pivot Point R1 | 0.6511 |
| Daily Pivot Point R2 | 0.6542 |
| Daily Pivot Point R3 | 0.6597 |
[/s2If]
Download Nehcap EAWe have two EAs that are operational on our LIVE accounts.
- EA-FIX: Check out the details here. Download EA-FIX . EA-FIX is a non-grid HFT scalper.
- EA-GROWTH: High quality low dd EA using trend grids. Download EA_GROWTHJoin Our Telegram Group
")


