The AUDUSD pair, currently at a rate of 0.64729, remains above both the 50-hour and 100-hour Exponential Moving Averages (EMAs) and shows an upward incline.
…
This is a premium post.
[s2If !current_user_can(access_s2member_level4)]Please register for FREE REGISTER to read full post below containing analysis. In case of any error or you think you are not able to read the full post below, please email us at support#nehcap.com [lwa][/s2If] [s2If current_user_can(access_s2member_level1)]
- AUD/USD holds above the 50- and 100-hour EMAs with an upward slope.
The pair currently trades last at 0.64729.
The previous day high was 0.6487 while the previous day low was 0.6401. The daily 38.2% Fib levels comes at 0.6454, expected to provide support. Similarly, the daily 61.8% fib level is at 0.6434, expected to provide support.
The AUD/USD pair recovers some lost ground near 0.6470 after retracing to the 0.6450 low during the early European session on Wednesday. The Australian Dollar (AUD) is under pressure after the monthly Consumer Price Index (CPI) revealed that inflation dropped to a 17-month low in July. This number might convince the Reserve Bank of Australia (RBA) to keep interest rates unchanged in the next policy meeting.
Technically, the AUD/USD pair trades above the 50- and 100-hour Exponential Moving Averages (EMAs) with an upward slope on the one-hour chart, indicating that the path of least resistance for the pair is to the upside.
It’s worth noting that the Relative Strength Index (RSI) stands in bullish territory above 50, challenging the pair’s immediate upside for the time being.
The immediate resistance level for AUD/USD is seen near a high of August 29 at 0.6485. Further north, the 0.6500-0.6505 regions appear a tough nut to crack for Aussie bears. The mentioned level represents the confluence of a psychological round mark, the upper boundary of Bollinger Band, and high of August 14. Any meaningful follow-through buying above the latter could pave the way to 0.6522 (high of August 15) and 0.6570 (high of August 9).
On the downside, the 50-hour EMA at 0.6445 acts as the initial support level for the pair. The additional downside filter to watch is seen at 0.6439 (100-hour EMA). Any intraday pullback below the latter would expose the next contention level at 0.6410 (the lower limit of the Bollinger Band). A decisive breach of the latter will see the next stop at 0.6380 (low of August 25) and finally at 0.6365 (low of August 17).
Technical Levels: Supports and Resistances
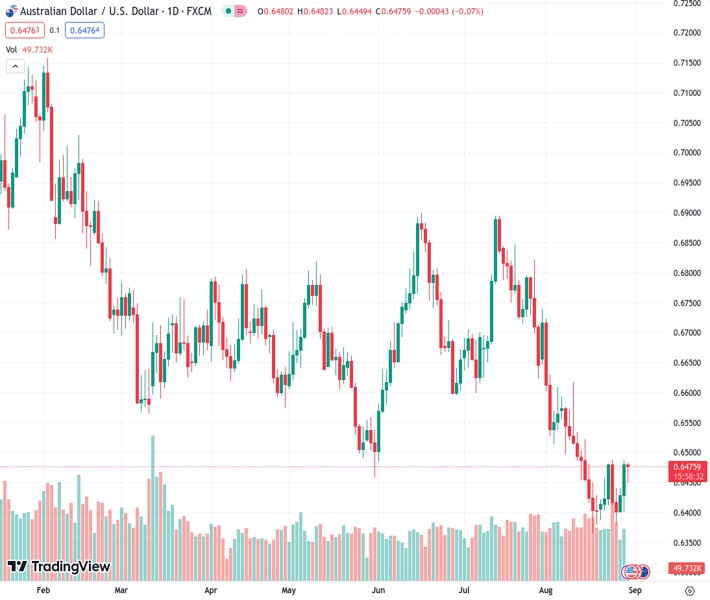
AUDUSD currently trading at 0.6473 at the time of writing. Pair opened at 0.648 and is trading with a change of -0.11 % .
| Overview | Overview.1 | |
|---|---|---|
| 0 | Today last price | 0.6473 |
| 1 | Today Daily Change | -0.0007 |
| 2 | Today Daily Change % | -0.1100 |
| 3 | Today daily open | 0.6480 |
The pair remains strongly bearish on the daily time frame. It trades below the 20 SMA @ 0.6477, 50 SMA 0.6622, 100 SMA @ 0.6651 and 200 SMA @ 0.6726.
| Trends | Trends.1 | |
|---|---|---|
| 0 | Daily SMA20 | 0.6477 |
| 1 | Daily SMA50 | 0.6622 |
| 2 | Daily SMA100 | 0.6651 |
| 3 | Daily SMA200 | 0.6726 |
The previous day high was 0.6487 while the previous day low was 0.6401. The daily 38.2% Fib levels comes at 0.6454, expected to provide support. Similarly, the daily 61.8% fib level is at 0.6434, expected to provide support.
Note the levels of interest below:
- Pivot support is noted at 0.6425, 0.6371, 0.634
- Pivot resistance is noted at 0.6511, 0.6542, 0.6597
| Levels | Levels.1 |
|---|---|
| Previous Daily High | 0.6487 |
| Previous Daily Low | 0.6401 |
| Previous Weekly High | 0.6488 |
| Previous Weekly Low | 0.6380 |
| Previous Monthly High | 0.6895 |
| Previous Monthly Low | 0.6599 |
| Daily Fibonacci 38.2% | 0.6454 |
| Daily Fibonacci 61.8% | 0.6434 |
| Daily Pivot Point S1 | 0.6425 |
| Daily Pivot Point S2 | 0.6371 |
| Daily Pivot Point S3 | 0.6340 |
| Daily Pivot Point R1 | 0.6511 |
| Daily Pivot Point R2 | 0.6542 |
| Daily Pivot Point R3 | 0.6597 |
[/s2If]
Download Nehcap EAWe have two EAs that are operational on our LIVE accounts.
- EA-FIX: Check out the details here. Download EA-FIX . EA-FIX is a non-grid HFT scalper.
- EA-GROWTH: High quality low dd EA using trend grids. Download EA_GROWTHJoin Our Telegram Group
")


