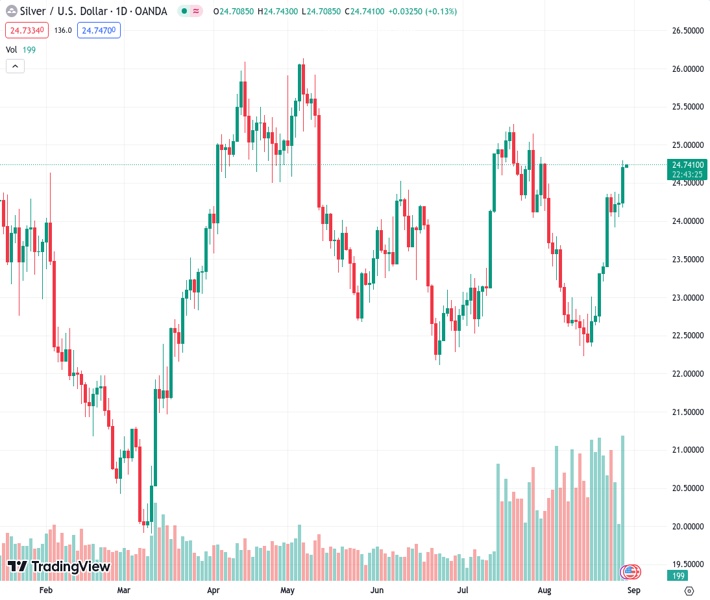
The XAGUSD pair has made significant progress, rising close to the $24.70 range and achieving an increase of over 2% in daily gains.
…
This is a premium post.
[s2If !current_user_can(access_s2member_level4)]Please register for FREE REGISTER to read full post below containing analysis. In case of any error or you think you are not able to read the full post below, please email us at support#nehcap.com [lwa][/s2If] [s2If current_user_can(access_s2member_level1)]
- XAG/USD advanced near the $24.70 area, showing more than 2% of daily gains.
The pair currently trades last at 24.740.
The previous day high was 24.36 while the previous day low was 24.05. The daily 38.2% Fib levels comes at 24.17, expected to provide support. Similarly, the daily 61.8% fib level is at 24.24, expected to provide support.
On Tuesday, the Silver Spot Price XAG/USD gained momentum, advancing near the $25.00 area displaying more than 2% gains on the day. The lower JOLTS Job Openings from July opened the upside on the grey metal on the back, declining US treasury bond yields as investors are now pricing in rate cuts by the Federal Reserve (Fed) in June 2024.
In reaction to the lower-than-expected employment data from the US, investors are placing dovish bets on the Federal Reserve (Fed), causing the US yields to decrease. The 2-year yield declined to 4.88%, its lowest in almost three weeks, while the 5- and 10-year yields declined to 4.28% and 4.12%, respectively, showing more than 2% of daily losses. As US yields are the opportunity cost of holding the non-yielding Silver, the grey metal found demand.
As for now, the CME FedWatch Tool suggests that investors are betting on a no-hike in the following September 20 meeting, while the odds of a hike of 25 basis points (bps) stand near 40% for the November meeting. The decline in the US yields may be explained but markets now anticipating rate cuts in June 2024, sooner than the previous expectations of those happening in July.
Focus now shifts to Wednesday’s Gross Domestic Product (GDP) for Q2 and the ADP Employment Change from August, which will help investors model their expectations for the next Fed decisions.
Based on the daily chart analysis, a bullish outlook is noted for XAG/USD short term. The Relative Strength Index (RSI) resides above its midline in positive territory with a northward slope, further validated by the green bars on the Moving Average Convergence Divergence (MACD), indicating a robust bullish momentum. Additionally, the pair is above the 20,100,200-day Simple Moving Average (SMA), indicating a favourable position for the bulls in the bigger picture.
Support levels: $24.30, $23.95 (100-day SMA), $23.30 (200-day SMA)
Resistance levels: $24.80, $25.00, $25.10
Technical Levels: Supports and Resistances
XAGUSD currently trading at 24.72 at the time of writing. Pair opened at 24.23 and is trading with a change of 2.02 % .
| Overview | Overview.1 | |
|---|---|---|
| 0 | Today last price | 24.72 |
| 1 | Today Daily Change | 0.49 |
| 2 | Today Daily Change % | 2.02 |
| 3 | Today daily open | 24.23 |
The pair remains strongly bullish on the daily timeframe. It trades above its 20 SMA @ 23.29, 50 SMA 23.53, 100 SMA @ 23.97 and 200 SMA @ 23.37.
| Trends | Trends.1 | |
|---|---|---|
| 0 | Daily SMA20 | 23.29 |
| 1 | Daily SMA50 | 23.53 |
| 2 | Daily SMA100 | 23.97 |
| 3 | Daily SMA200 | 23.37 |
The previous day high was 24.36 while the previous day low was 24.05. The daily 38.2% Fib levels comes at 24.17, expected to provide support. Similarly, the daily 61.8% fib level is at 24.24, expected to provide support.
Note the levels of interest below:
- Pivot support is noted at 24.07, 23.9, 23.76
- Pivot resistance is noted at 24.38, 24.52, 24.68
| Levels | Levels.1 |
|---|---|
| Previous Daily High | 24.36 |
| Previous Daily Low | 24.05 |
| Previous Weekly High | 24.38 |
| Previous Weekly Low | 22.67 |
| Previous Monthly High | 25.27 |
| Previous Monthly Low | 22.52 |
| Daily Fibonacci 38.2% | 24.17 |
| Daily Fibonacci 61.8% | 24.24 |
| Daily Pivot Point S1 | 24.07 |
| Daily Pivot Point S2 | 23.90 |
| Daily Pivot Point S3 | 23.76 |
| Daily Pivot Point R1 | 24.38 |
| Daily Pivot Point R2 | 24.52 |
| Daily Pivot Point R3 | 24.68 |
[/s2If]
Download Nehcap EAWe have two EAs that are operational on our LIVE accounts.
- EA-FIX: Check out the details here. Download EA-FIX . EA-FIX is a non-grid HFT scalper.
- EA-GROWTH: High quality low dd EA using trend grids. Download EA_GROWTHJoin Our Telegram Group
")


