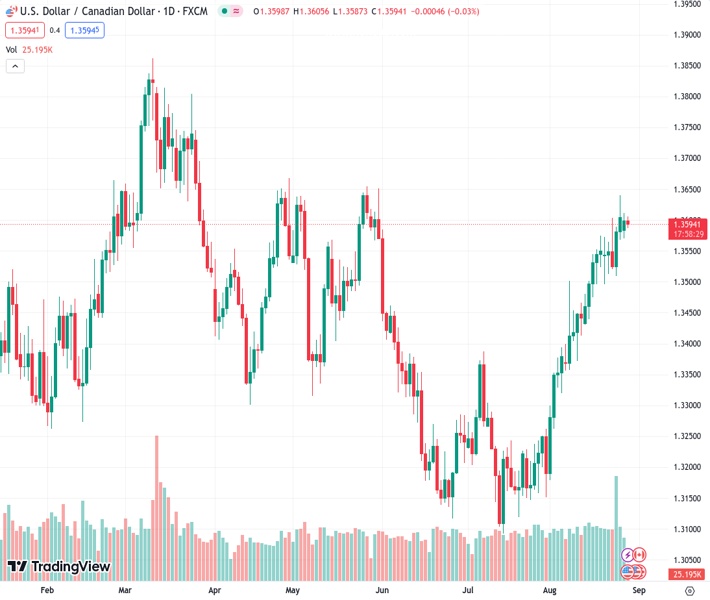
The USDCAD exchange rate at 1.35943 remains under pressure, as Monday’s bearish Doji candlestick pattern and reversal from an important resistance level indicate. According to the analysis from Nehcap, a continued decline is anticipated.
…
This is a premium post.
[s2If !current_user_can(access_s2member_level4)]Please register for FREE REGISTER to read full post below containing analysis. In case of any error or you think you are not able to read the full post below, please email us at support#nehcap.com [lwa][/s2If] [s2If current_user_can(access_s2member_level1)]
- USD/CAD stays pressured while justifying Monday’s bearish Doji, reversal from key resistance line.
The pair currently trades last at 1.35943.
The previous day high was 1.3612 while the previous day low was 1.357. The daily 38.2% Fib levels comes at 1.3586, expected to provide support. Similarly, the daily 61.8% fib level is at 1.3596, expected to provide resistance.
USD/CAD remains on the back foot around 1.3600 after reversing from a three-month high the last week, not to forget the previous day’s U-turn from an important resistance line. That said, the Loonie pair teases bears around the intraday low of 1.3590 during early Tuesday morning in Europe.
In doing so, the Loonie pair not only defends the previous day’s U-turn from a four-month-old resistance line but also justifies the overbought RSI (14) line and the impending bear cross on the MACD indicator. Additionally luring the USD/CAD sellers is the previous day’s Doji candlestick on the Daily chart.
With this, the Loonie pair appears all set to decline towards an upward-sloping support line from August 04, close to 1.3550 by the press time. However, the 200-DMA level of 1.3460 will challenge the USD/CAD pair’s further downside.
Also acting as the downside filter is the previous monthly high of near 1.3385 and May’s bottom surrounding 1.3315.
On the flip side, a daily closing beyond the aforementioned resistance line stretched from late April, around 1.3615, becomes necessary to convince the USD/CAD buyers.
Even so, the tops marked in May and April, near 1.3655 and 1.3670 in that order, will challenge the bulls before giving them control.
It’s worth mentioning that the latest rebound in the Oil price, Canada’s key export item joins the US Dollar’s retreat ahead of the CB Consumer Confidence data for August to weigh on the USD/CAD pair of late.
Trend: Further downside expected
Technical Levels: Supports and Resistances
USDCAD currently trading at 1.3596 at the time of writing. Pair opened at 1.36 and is trading with a change of -0.03% % .
| Overview | Overview.1 | |
|---|---|---|
| 0 | Today last price | 1.3596 |
| 1 | Today Daily Change | -0.0004 |
| 2 | Today Daily Change % | -0.03% |
| 3 | Today daily open | 1.36 |
The pair remains strongly bullish on the daily timeframe. It trades above its 20 SMA @ 1.3473, 50 SMA 1.3317, 100 SMA @ 1.339 and 200 SMA @ 1.346.
| Trends | Trends.1 | |
|---|---|---|
| 0 | Daily SMA20 | 1.3473 |
| 1 | Daily SMA50 | 1.3317 |
| 2 | Daily SMA100 | 1.3390 |
| 3 | Daily SMA200 | 1.3460 |
The previous day high was 1.3612 while the previous day low was 1.357. The daily 38.2% Fib levels comes at 1.3586, expected to provide support. Similarly, the daily 61.8% fib level is at 1.3596, expected to provide resistance.
Note the levels of interest below:
- Pivot support is noted at 1.3576, 1.3552, 1.3534
- Pivot resistance is noted at 1.3618, 1.3636, 1.3659
| Levels | Levels.1 |
|---|---|
| Previous Daily High | 1.3612 |
| Previous Daily Low | 1.3570 |
| Previous Weekly High | 1.3640 |
| Previous Weekly Low | 1.3496 |
| Previous Monthly High | 1.3387 |
| Previous Monthly Low | 1.3093 |
| Daily Fibonacci 38.2% | 1.3586 |
| Daily Fibonacci 61.8% | 1.3596 |
| Daily Pivot Point S1 | 1.3576 |
| Daily Pivot Point S2 | 1.3552 |
| Daily Pivot Point S3 | 1.3534 |
| Daily Pivot Point R1 | 1.3618 |
| Daily Pivot Point R2 | 1.3636 |
| Daily Pivot Point R3 | 1.3659 |
[/s2If]
Download Nehcap EAWe have two EAs that are operational on our LIVE accounts.
- EA-FIX: Check out the details here. Download EA-FIX . EA-FIX is a non-grid HFT scalper.
- EA-GROWTH: High quality low dd EA using trend grids. Download EA_GROWTHJoin Our Telegram Group
")


