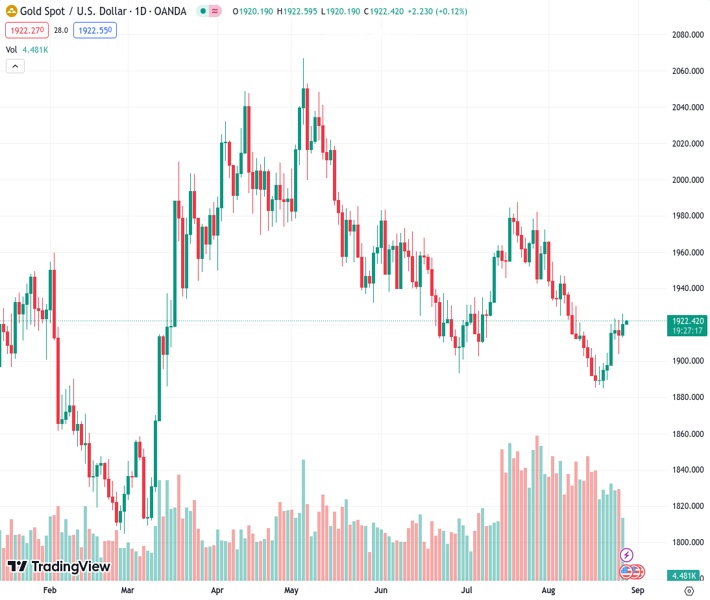
The price of gold, symbolized by #XAUUSD, is rising for the second consecutive day and is still near its highest point in over two weeks.
…
This is a premium post.
[s2If !current_user_can(access_s2member_level4)]Please register for FREE REGISTER to read full post below containing analysis. In case of any error or you think you are not able to read the full post below, please email us at support#nehcap.com [lwa][/s2If] [s2If current_user_can(access_s2member_level1)]
- Gold edges higher for the second straight day and remains close to over a two-week peak.
The pair currently trades last at 1922.30.
The previous day high was 1926.14 while the previous day low was 1912.84. The daily 38.2% Fib levels comes at 1921.06, expected to provide support. Similarly, the daily 61.8% fib level is at 1917.92, expected to provide support.
Gold price attracts some buying for the second successive day on Tuesday and remains well within the striking distance of over a two-week high touched the previous day. The XAU/USD trades above the $1,920 level during the Asian session and draws support from a modest US Dollar (USD) downtick.
In fact, the USD Index (DXY), which tracks the Greenback against a basket of currencies, retreats further from its highest level since June 1 set on Friday and is seen as a key factor lending support to the Gold price. The USD downtick could be attributed to a further pullback in the US Treasury bond yields, though the possibility of more interest rate hikes by the Federal Reserve (Fed) should help limit any meaningful decline. In fact, Fed Chair Jerome Powell, in a keynote address at the Jackson Hole Symposium, said on Friday, that inflation remains too high and that the central bank is ready to continue hiking rates to tame persistently high prices.
Apart from sticky inflation, a surprisingly resilient US economy could force the Fed to keep interest rates higher for longer. The expectations had pushed the yield on the benchmark 10-year US government bond to its highest level since November 2007 last week and should continue to act as a tailwind for the USD. This, along with a positive risk tone, bolstered by new measures rolled out by China over the weekend to draw investors back into its battered stock markets, should contribute to capping the safe-haven Gold price. This, in turn, warrants some caution before positioning for any further appreciating move for the XAU/USD.
The downside, meanwhile, seems cushioned, at least for the time being, in the wake of worries about a deeper global economic downturn, particularly in China, which tends to benefit the traditional safe-haven Gold price. Hence, the market focus will remain glued to this week’s release of Chinese PMI prints for August. Apart from this, investors will take cues from important US macro data scheduled at the beginning of a new month, including the closely-watched Non-Farm Payrolls (NFP) report. This, in turn, will provide some meaningful impetus and help in determining the next leg of a directional move for the precious metal.
Technical Levels: Supports and Resistances
XAUUSD currently trading at 1921.68 at the time of writing. Pair opened at 1920.1 and is trading with a change of 0.08 % .
| Overview | Overview.1 | |
|---|---|---|
| 0 | Today last price | 1921.68 |
| 1 | Today Daily Change | 1.58 |
| 2 | Today Daily Change % | 0.08 |
| 3 | Today daily open | 1920.10 |
The pair is trading above its 20 Daily moving average @ 1914.9, below its 50 Daily moving average @ 1930.14 , below its 100 Daily moving average @ 1957.32 and above its 200 Daily moving average @ 1911.0
| Trends | Trends.1 | |
|---|---|---|
| 0 | Daily SMA20 | 1914.90 |
| 1 | Daily SMA50 | 1930.14 |
| 2 | Daily SMA100 | 1957.32 |
| 3 | Daily SMA200 | 1911.00 |
The previous day high was 1926.14 while the previous day low was 1912.84. The daily 38.2% Fib levels comes at 1921.06, expected to provide support. Similarly, the daily 61.8% fib level is at 1917.92, expected to provide support.
Note the levels of interest below:
- Pivot support is noted at 1913.25, 1906.39, 1899.95
- Pivot resistance is noted at 1926.55, 1932.99, 1939.85
| Levels | Levels.1 |
|---|---|
| Previous Daily High | 1926.14 |
| Previous Daily Low | 1912.84 |
| Previous Weekly High | 1923.43 |
| Previous Weekly Low | 1884.85 |
| Previous Monthly High | 1987.54 |
| Previous Monthly Low | 1902.77 |
| Daily Fibonacci 38.2% | 1921.06 |
| Daily Fibonacci 61.8% | 1917.92 |
| Daily Pivot Point S1 | 1913.25 |
| Daily Pivot Point S2 | 1906.39 |
| Daily Pivot Point S3 | 1899.95 |
| Daily Pivot Point R1 | 1926.55 |
| Daily Pivot Point R2 | 1932.99 |
| Daily Pivot Point R3 | 1939.85 |
[/s2If]
Download Nehcap EAWe have two EAs that are operational on our LIVE accounts.
- EA-FIX: Check out the details here. Download EA-FIX . EA-FIX is a non-grid HFT scalper.
- EA-GROWTH: High quality low dd EA using trend grids. Download EA_GROWTHJoin Our Telegram Group
")


