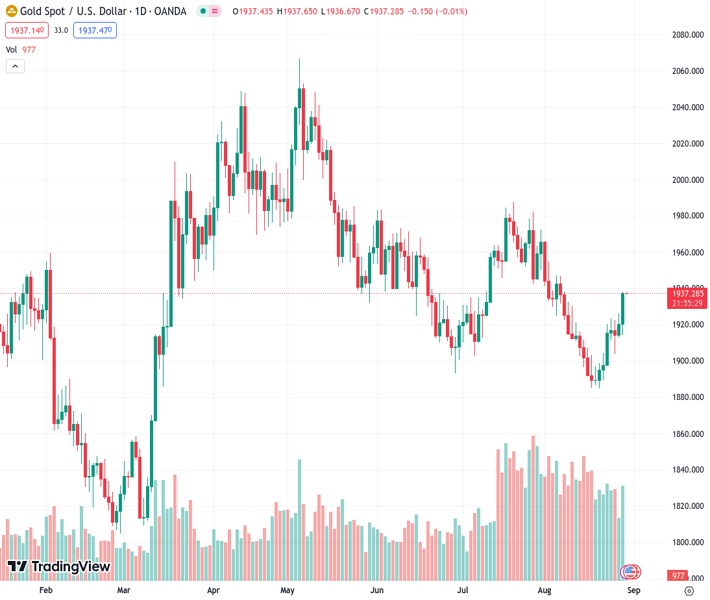
The price of gold, currently at $1,937.33 per ounce, remains strong at its highest level in three weeks as buyers aim to overcome the resistance level of $1,945. The viewpoint of Nehcap is that there is potential for further increases in the future.
…
This is a premium post.
[s2If !current_user_can(access_s2member_level4)]Please register for FREE REGISTER to read full post below containing analysis. In case of any error or you think you are not able to read the full post below, please email us at support#nehcap.com [lwa][/s2If] [s2If current_user_can(access_s2member_level1)]
- Gold Price stays firmer at three-week high as bulls attack $1,945 resistance confluence.
The pair currently trades last at 1937.33.
The previous day high was 1926.14 while the previous day low was 1912.84. The daily 38.2% Fib levels comes at 1921.06, expected to provide support. Similarly, the daily 61.8% fib level is at 1917.92, expected to provide support.
Gold Price (XAU/USD) stays firmer at the highest level in three weeks despite making rounds to $1,937-38 amid early hours of Wednesday’s Asian session. In doing so, the precious metal cheers the broad US Dollar weakness ahead of the key United States (US) data. Also favoring the XAU/USD are the downbeat US Treasury bond yields and hopes of more stimulus from China. However, the recent headlines surrounding the US-China ties and the International Monetary Fund’s (IMF) cautious view about the future allocations of the Special Drawing Rights (SDRs) seem to prod the Gold buyers ahead of the second-tier US statistics.
Gold Price crossed the 50-day Simple Moving Average (SMA), as well as rose the most in a week, after the United States data challenged the Federal Reserve (Fed) hawks on Tuesday. Adding strength to the XAU/USD upside were concerns about more stimulus from China, one of the biggest Gold customers, as well as the downbeat US Treasury bond yields.
On Tuesday, the US Conference Board’s (CB) Consumer Confidence Index slumped to 106.10 for August from a downwardly revised 114.00 prior (from 117.0), versus 116.0 market forecasts. That said, the US JOLTS Job Openings slumped to the lowest since March 2021, to 8.827M for July versus 9.465M expected and 9.165M prior (revised from 9.582). Additionally, the US Housing Price Index eased to 0.3% MoM for June from 0.7% prior and 0.2% while the S&P/Case-Shiller Home Price Indices improved to -1.2% YoY from -1.7% previous readings and -1.3% market forecasts.
It’s worth noting that the mostly downbeat US data fuelled fears of the Fed’s September policy pivot. With this, the CME’s FedWatch Tool signals 16% chance of a rate hike versus 20% prior. The same propelled Wall Street and weighed on the US Treasury bond yields, as well as the US Dollar. That said, the Wall Street benchmarks rose for the third consecutive day while the US 10-year Treasury bond yields dropped to the lowest level in 13 days by the end of Tuesday’s North American trading session. Further, the US Dollar Index (DXY) fell the most in six weeks to around 103.50 at the latest.
Elsewhere, chatters about the early rate cuts from the People’s Bank of China (PBoC) and a cut into the mortgage rates from the Dragon Nation also helped the Gold buyers to remain hopeful. However, US Commerce Secretary Gina Raimondo’s complaints about the hardships for the US firmer in China prod the XAU/USD bulls. On the same line could be the International Monetary Fund’s (IMF) readiness to be more cautious while allocating the Special Drawing Rights (SDRs) in the future, due to the current environment of higher interest rates and inflation.
Having witnessed a stellar run-up due to the downbeat US Dollar, the Gold Price may witness a consolidation ahead of the early signals of the US employment and inflation. Among them, the US ADP Employment Change, the final readings of the US second quarter (Q2) Gross Domestic Product (GDP) and the Personal Consumption Expenditure (PCE) are the key to watch.
Gold Price justifies the sustained trading beyond $1,910 support confluence, as well as upside break of the 50-day Simple Moving Average (DMA), while pleasing buyers at the highest levels in three weeks.
Adding strength to the upside bias about the XAU/USD are the bullish signals of the Moving Average Convergence and Divergence (MACD) indicator and the firmer Relative Strength Index (RSI) line, placed at 14, not overbought.
With this, the Gold Price appears all set to prod the $1,945 key resistance comprising the 50% Fibonacci retracement of February–May upside and a downward-sloping trend line from the yearly top marked in May.
However, a daily closing beyond the said $1,945 resistance will allow the Gold buyers to aim for the previous monthly high of around $1,987 before challenging the $2,000 threshold.
On the contrary, the 50-DMA level of near $1,930 restricts immediate downside of the XAU/USD ahead of the $1,910 support confluence encompassing the 200-DMA and the 61.8% Fibonacci retracement, also known as the Golden Ratio.
Should the Gold Price remains weak past $1,910, the $1,900 round figure and the monthly low of around $1,885 will test the bears ahead of highlighting a horizontal support zone including multiple levels marked in February and early March, close to $1,858–61.
Trend: Further upside expected
Technical Levels: Supports and Resistances
XAUUSD currently trading at 1937.25 at the time of writing. Pair opened at 1920.1 and is trading with a change of 0.89% % .
| Overview | Overview.1 | |
|---|---|---|
| 0 | Today last price | 1937.25 |
| 1 | Today Daily Change | 17.15 |
| 2 | Today Daily Change % | 0.89% |
| 3 | Today daily open | 1920.1 |
The pair is trading above its 20 Daily moving average @ 1914.9, above its 50 Daily moving average @ 1930.14 , below its 100 Daily moving average @ 1957.32 and above its 200 Daily moving average @ 1911.0
| Trends | Trends.1 | |
|---|---|---|
| 0 | Daily SMA20 | 1914.90 |
| 1 | Daily SMA50 | 1930.14 |
| 2 | Daily SMA100 | 1957.32 |
| 3 | Daily SMA200 | 1911.00 |
The previous day high was 1926.14 while the previous day low was 1912.84. The daily 38.2% Fib levels comes at 1921.06, expected to provide support. Similarly, the daily 61.8% fib level is at 1917.92, expected to provide support.
Note the levels of interest below:
- Pivot support is noted at 1913.25, 1906.39, 1899.95
- Pivot resistance is noted at 1926.55, 1932.99, 1939.85
| Levels | Levels.1 |
|---|---|
| Previous Daily High | 1926.14 |
| Previous Daily Low | 1912.84 |
| Previous Weekly High | 1923.43 |
| Previous Weekly Low | 1884.85 |
| Previous Monthly High | 1987.54 |
| Previous Monthly Low | 1902.77 |
| Daily Fibonacci 38.2% | 1921.06 |
| Daily Fibonacci 61.8% | 1917.92 |
| Daily Pivot Point S1 | 1913.25 |
| Daily Pivot Point S2 | 1906.39 |
| Daily Pivot Point S3 | 1899.95 |
| Daily Pivot Point R1 | 1926.55 |
| Daily Pivot Point R2 | 1932.99 |
| Daily Pivot Point R3 | 1939.85 |
[/s2If]
Download Nehcap EAWe have two EAs that are operational on our LIVE accounts.
- EA-FIX: Check out the details here. Download EA-FIX . EA-FIX is a non-grid HFT scalper.
- EA-GROWTH: High quality low dd EA using trend grids. Download EA_GROWTHJoin Our Telegram Group
")


