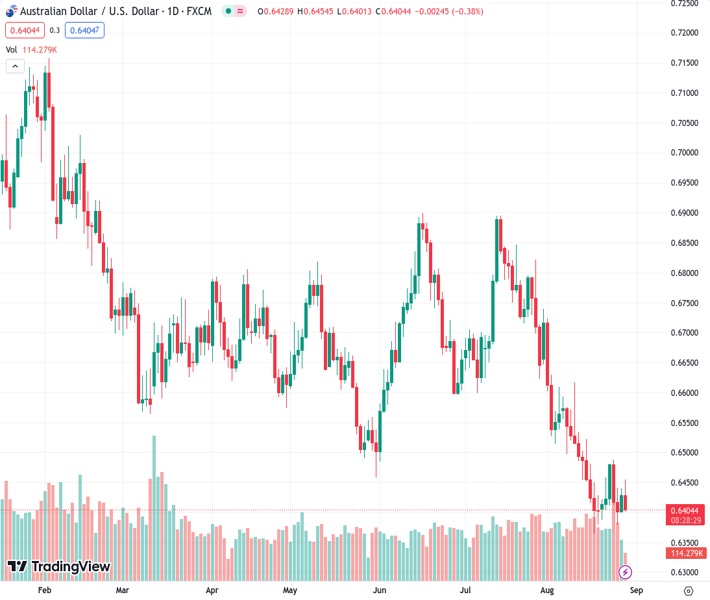
The AUDUSD pair, currently trading at 0.64032, encounters resistance around the 0.6450 level as the US Dollar strengthens in anticipation of the release of ADP Employment data.
…
This is a premium post.
[s2If !current_user_can(access_s2member_level4)]Please register for FREE REGISTER to read full post below containing analysis. In case of any error or you think you are not able to read the full post below, please email us at support#nehcap.com [lwa][/s2If] [s2If current_user_can(access_s2member_level1)]
- AUD/USD finds selling pressure near 0.6450 as US Dollar recovers ahead of ADP Employment data.
The pair currently trades last at 0.64032.
The previous day high was 0.644 while the previous day low was 0.6402. The daily 38.2% Fib levels comes at 0.6425, expected to provide resistance. Similarly, the daily 61.8% fib level is at 0.6416, expected to provide resistance.
The AUD/USD pair faces selling pressure after a short-lived pullback move to near 0.6450 in the European session. The Aussie asset attracts offers as the US Dollar recovers after a subdued performance ahead of the United States private sector labor market data.
Investors are keenly focusing on US Automated Data Processing (ADP) Employment data for August, which will be published on Wednesday at 12:15. August labor market data carries higher significance as Federal Reserve (Fed) Chair Jerome Powell confirmed at Jackson Hole that further policy action will be data-dependent. And, inflation has become more responsive to the labor market.
Meanwhile, the Australian Dollar fails to hold ground despite Reserve Bank of Australia (RBA) Governor-Designate, Michelle Bullock at the Australian National University, in Canberra, said that the central bank “may have to raise rates again, but watching data carefully.”
AUD/USD delivers a breakdown of a small Ascending Triangle chart pattern formed on an hourly time frame. The Aussie asset is still not exposed to a fresh low as the downside seems supported near 0.6360 while the upside is restricted due to the horizontal resistance plotted from August 15 high around 0.6500.
The 200-period Exponential Moving Average (EMA) continues to act as a barricade for the Australian Dollar. A shift into the bearish range of 20.00-40.00 by the Relative Strength Index (RSI) (14) will activate the downside momentum.
A fresh downside would appear if the Aussie asset dropped below August 17 low around 0.6360. This would expose the asset to the round-level support of 0.6300 followed by 03 November 2022 low at 0.6272.
In an alternate scenario, a recovery move above August 15 high around 0.6522 will drive the asset to August 9 high at 0.6571. Breach of the latter will drive the asset towards August 10 high at 0.6616.
Technical Levels: Supports and Resistances
AUDUSD currently trading at 0.6419 at the time of writing. Pair opened at 0.6429 and is trading with a change of -0.16 % .
| Overview | Overview.1 | |
|---|---|---|
| 0 | Today last price | 0.6419 |
| 1 | Today Daily Change | -0.0010 |
| 2 | Today Daily Change % | -0.1600 |
| 3 | Today daily open | 0.6429 |
The pair remains strongly bearish on the daily time frame. It trades below the 20 SMA @ 0.6484, 50 SMA 0.6628, 100 SMA @ 0.6652 and 200 SMA @ 0.6726.
| Trends | Trends.1 | |
|---|---|---|
| 0 | Daily SMA20 | 0.6484 |
| 1 | Daily SMA50 | 0.6628 |
| 2 | Daily SMA100 | 0.6652 |
| 3 | Daily SMA200 | 0.6726 |
The previous day high was 0.644 while the previous day low was 0.6402. The daily 38.2% Fib levels comes at 0.6425, expected to provide resistance. Similarly, the daily 61.8% fib level is at 0.6416, expected to provide resistance.
Note the levels of interest below:
- Pivot support is noted at 0.6407, 0.6386, 0.6369
- Pivot resistance is noted at 0.6445, 0.6462, 0.6483
| Levels | Levels.1 |
|---|---|
| Previous Daily High | 0.6440 |
| Previous Daily Low | 0.6402 |
| Previous Weekly High | 0.6488 |
| Previous Weekly Low | 0.6380 |
| Previous Monthly High | 0.6895 |
| Previous Monthly Low | 0.6599 |
| Daily Fibonacci 38.2% | 0.6425 |
| Daily Fibonacci 61.8% | 0.6416 |
| Daily Pivot Point S1 | 0.6407 |
| Daily Pivot Point S2 | 0.6386 |
| Daily Pivot Point S3 | 0.6369 |
| Daily Pivot Point R1 | 0.6445 |
| Daily Pivot Point R2 | 0.6462 |
| Daily Pivot Point R3 | 0.6483 |
[/s2If]
Download Nehcap EAWe have two EAs that are operational on our LIVE accounts.
- EA-FIX: Check out the details here. Download EA-FIX . EA-FIX is a non-grid HFT scalper.
- EA-GROWTH: High quality low dd EA using trend grids. Download EA_GROWTHJoin Our Telegram Group
")


