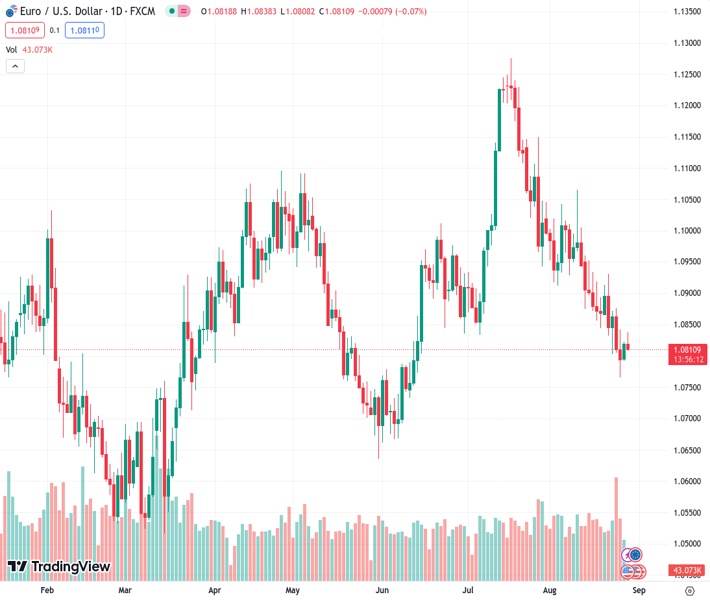
On a four-hour chart, the EURUSD currency pair is currently trading at 1.08106 and remains below both the 50-day and 100-day Exponential Moving Averages (EMAs).
…
This is a premium post.
[s2If !current_user_can(access_s2member_level4)]Please register for FREE REGISTER to read full post below containing analysis. In case of any error or you think you are not able to read the full post below, please email us at support#nehcap.com [lwa][/s2If] [s2If current_user_can(access_s2member_level1)]
- EUR/USD holds below the 50- and 100-day EMAs on a four-hour chart.
The pair currently trades last at 1.08106.
The previous day high was 1.0822 while the previous day low was 1.0794. The daily 38.2% Fib levels comes at 1.0811, expected to provide resistance. Similarly, the daily 61.8% fib level is at 1.0805, expected to provide support.
The EUR/USD pair recovers some lost ground but the upside seem limited during the early European session on Tuesday. The major pair currently trades near 1.0816, losing 0.03% on the day. The odds of additional interest rate hikes by the Federal Reserve (Fed) lift US bond yields and limit USD losses.
According to the four-hour chart, the major pair holds below the 50- and 100-day Exponential Moving Averages (EMAs), implying the path of least resistance for the EUR/USD is to the downside. Adding to this, the Relative Strength Index (RSI) remains below 50, supporting EUR/USD sellers for now.
The immediate resistance level for EUR/USD appears at 1.0845-1.0850 region, representing a confluence of the 50-hour EMA and the upper boundary of the Bollinger Band. Further north, the pair will challenge the next hurdle at 1.0890 (100-hour EMA).
Any meaningful follow-through buying beyond the latter could pave the way to the next barrier at 1.0930 (a high of August 22) en route to 1.1000 (a psychological round mark, a high of August 8)and finally at 1.1065 (a high of August 10).
On the flip side, the key support level to watch is 1.0800, portraying a psychological round mark and a low of August 23. The additional downside stop is near the limit of the Bollinger Band and a low of August 25 at the 1.0765-1.0770 region. A decisive break below the latter would fuel a drop towards 1.0735 (a low of June 12) and 1.0675 (a low of June 6).
Technical Levels: Supports and Resistances
EURUSD currently trading at 1.0818 at the time of writing. Pair opened at 1.0819 and is trading with a change of -0.01 % .
| Overview | Overview.1 | |
|---|---|---|
| 0 | Today last price | 1.0818 |
| 1 | Today Daily Change | -0.0001 |
| 2 | Today Daily Change % | -0.0100 |
| 3 | Today daily open | 1.0819 |
The pair is trading below its 20 Daily moving average @ 1.091, below its 50 Daily moving average @ 1.0975 , below its 100 Daily moving average @ 1.0927 and above its 200 Daily moving average @ 1.0806
| Trends | Trends.1 | |
|---|---|---|
| 0 | Daily SMA20 | 1.0910 |
| 1 | Daily SMA50 | 1.0975 |
| 2 | Daily SMA100 | 1.0927 |
| 3 | Daily SMA200 | 1.0806 |
The previous day high was 1.0822 while the previous day low was 1.0794. The daily 38.2% Fib levels comes at 1.0811, expected to provide resistance. Similarly, the daily 61.8% fib level is at 1.0805, expected to provide support.
Note the levels of interest below:
- Pivot support is noted at 1.0801, 1.0783, 1.0772
- Pivot resistance is noted at 1.083, 1.084, 1.0859
| Levels | Levels.1 |
|---|---|
| Previous Daily High | 1.0822 |
| Previous Daily Low | 1.0794 |
| Previous Weekly High | 1.0930 |
| Previous Weekly Low | 1.0766 |
| Previous Monthly High | 1.1276 |
| Previous Monthly Low | 1.0834 |
| Daily Fibonacci 38.2% | 1.0811 |
| Daily Fibonacci 61.8% | 1.0805 |
| Daily Pivot Point S1 | 1.0801 |
| Daily Pivot Point S2 | 1.0783 |
| Daily Pivot Point S3 | 1.0772 |
| Daily Pivot Point R1 | 1.0830 |
| Daily Pivot Point R2 | 1.0840 |
| Daily Pivot Point R3 | 1.0859 |
[/s2If]
Download Nehcap EAWe have two EAs that are operational on our LIVE accounts.
- EA-FIX: Check out the details here. Download EA-FIX . EA-FIX is a non-grid HFT scalper.
- EA-GROWTH: High quality low dd EA using trend grids. Download EA_GROWTHJoin Our Telegram Group
")


