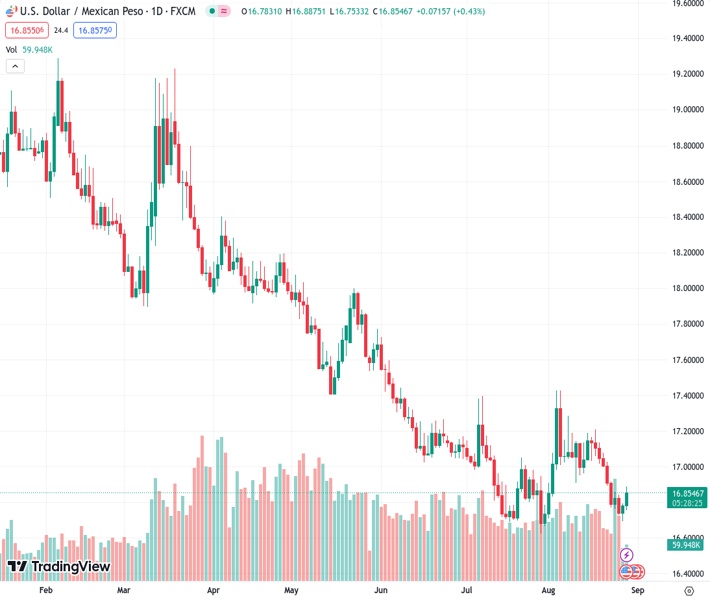
Mexico’s second-quarter GDP growth was lower than expected at 0.8% quarter-on-quarter. As a result, the US dollar to Mexican peso exchange rate increased to 16.8508. Additionally, Banxico decided to keep interest rates at 11.25%.
…
This is a premium post.
[s2If !current_user_can(access_s2member_level4)]Please register for FREE REGISTER to read full post below containing analysis. In case of any error or you think you are not able to read the full post below, please email us at support#nehcap.com [lwa][/s2If] [s2If current_user_can(access_s2member_level1)]
- Mexico’s Q2 GDP growth comes in below expectations at 0.8% QoQ, pushing USD/MXN higher as Banxico holds rates steady at 11.25%.
The pair currently trades last at 16.8508.
The previous day high was 16.796 while the previous day low was 16.6945. The daily 38.2% Fib levels comes at 16.7572, expected to provide support. Similarly, the daily 61.8% fib level is at 16.7333, expected to provide support.
The Mexican Peso (MXN) loses ground against the US Dollar (USD) as economic data in Mexico was soft, even though the agenda in the United States (US) increased speculation the US Federal Reserve (Fed) could pause its tightening cycle in September. However, the USD/MXN reversed its course climbs by 0.51%, trading at 16.8659, after hitting a daily low of 16.7533.
According to the Instituto Nacional de Estadistica Geografia e Informatica (INEGI), Mexico’s economy grew slower than expected. Gross Domestic Product (GDP) for Q2 2023 came at 0.8% QoQ, below forecasts of 1%, and in annually-based figures at 3.6% from 3.7% expected. Sources cited by Reuters commented that “tighter financial conditions and the weakness of key sectors …are now a clear drag.” After the data, the USD/MXN extended its gains. Traders must be aware that the Bank of Mexico (Banxico) kept borrowing costs unchanged at their last decision at 11.25%, stating that rates would remain higher for an extended period.
Across the border, the US economic docket revealed that Job Openings declined from 9.165M in June to 8.827M in July, well below estimates of 9.465M, as the Bureau of Labor Statistics (BLS) reported. Given that Fed Chair Jerome Powell stressed that should the labor market continue to loosen, inflation would continue its downtrend, expectations for September’s rate hike faded. The CME FedWatch Tool shows odds for keeping rates unchanged at 5.25%-5.50%, jumped from 78% to 86.5% in one day.
Other data revealed simultaneously by the Conference Board (CB) showed that Consumer Confidence is deteriorating, falling to 106.1 this month from 114 in July, even though estimates were at 116. According to Dana Peterson, chief economist at the Conference Board, “Consumers were once again preoccupied with rising prices in general, and for groceries and gasoline in particular.”
The report highlighted that inflation expectations for a year ahead jumped to 5.8%. The CB poll showed Americans are confident about finding a job, which shows the labor market is beginning to feel the pain of 525 basis points of tightening by the Fed.
Despite today’s data showing the US economy is decelerating, inflation remains high. Given that Jerome Powell, in his last speech, revealed that a couple of good inflation reports are not enough to stir the US central bank from tightening policy, next Friday’s US Nonfarm Payrolls report could be decisive in dictating the path of the US Dollar.
For the USD/MXN, if the US economy decelerates further and recessionary fears reignite, it could weaken the emerging market currency. Hence, further upside is expected in the pair, as traders would move to a risk-off environment and seek the safety of the US Dollar.
The USD/MXN daily chart portrays the pair as in an upward correction toward the confluence of the 50 and the 20-day Moving Average (DMA) at around 16.9778-17.0047, following the data. Still, buyers must achieve a daily close above August’s 23 high of 16.9151 to remain hopeful for higher prices. Downside risks emerge at the current week’s low of 16.6923 and the year-to-date (YTD) low of 16.6238.
Technical Levels: Supports and Resistances
USDMXN currently trading at 16.8542 at the time of writing. Pair opened at 16.7898 and is trading with a change of 0.38 % .
| Overview | Overview.1 | |
|---|---|---|
| 0 | Today last price | 16.8542 |
| 1 | Today Daily Change | 0.0644 |
| 2 | Today Daily Change % | 0.3800 |
| 3 | Today daily open | 16.7898 |
The pair remains strongly bearish on the daily time frame. It trades below the 20 SMA @ 17.0148, 50 SMA 16.9925, 100 SMA @ 17.351 and 200 SMA @ 18.1138.
| Trends | Trends.1 | |
|---|---|---|
| 0 | Daily SMA20 | 17.0148 |
| 1 | Daily SMA50 | 16.9925 |
| 2 | Daily SMA100 | 17.3510 |
| 3 | Daily SMA200 | 18.1138 |
The previous day high was 16.796 while the previous day low was 16.6945. The daily 38.2% Fib levels comes at 16.7572, expected to provide support. Similarly, the daily 61.8% fib level is at 16.7333, expected to provide support.
Note the levels of interest below:
- Pivot support is noted at 16.7242, 16.6586, 16.6227
- Pivot resistance is noted at 16.8257, 16.8616, 16.9272
| Levels | Levels.1 |
|---|---|
| Previous Daily High | 16.7960 |
| Previous Daily Low | 16.6945 |
| Previous Weekly High | 17.0800 |
| Previous Weekly Low | 16.7366 |
| Previous Monthly High | 17.3957 |
| Previous Monthly Low | 16.6258 |
| Daily Fibonacci 38.2% | 16.7572 |
| Daily Fibonacci 61.8% | 16.7333 |
| Daily Pivot Point S1 | 16.7242 |
| Daily Pivot Point S2 | 16.6586 |
| Daily Pivot Point S3 | 16.6227 |
| Daily Pivot Point R1 | 16.8257 |
| Daily Pivot Point R2 | 16.8616 |
| Daily Pivot Point R3 | 16.9272 |
[/s2If]
Download Nehcap EAWe have two EAs that are operational on our LIVE accounts.
- EA-FIX: Check out the details here. Download EA-FIX . EA-FIX is a non-grid HFT scalper.
- EA-GROWTH: High quality low dd EA using trend grids. Download EA_GROWTHJoin Our Telegram Group
")


