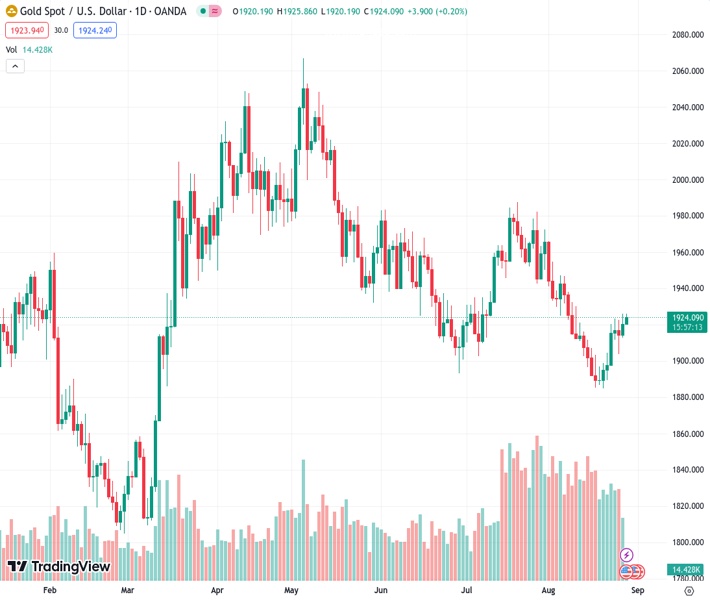
For the second day in a row, the price of gold at $1,924.26 is drawing the attention of buyers due to a slight decline in the strength of the US dollar.
…
This is a premium post.
[s2If !current_user_can(access_s2member_level4)]Please register for FREE REGISTER to read full post below containing analysis. In case of any error or you think you are not able to read the full post below, please email us at support#nehcap.com [lwa][/s2If] [s2If current_user_can(access_s2member_level1)]
- Gold price attracts some buyers for the second successive day amid modest USD weakness.
The pair currently trades last at 1924.26.
The previous day high was 1926.14 while the previous day low was 1912.84. The daily 38.2% Fib levels comes at 1921.06, expected to provide support. Similarly, the daily 61.8% fib level is at 1917.92, expected to provide support.
Gold price gains some positive traction for the second successive day on Tuesday and climbs to the $1,925-$1,926 area during the Asian session, or over a two-week high touched the previous day.
The ongoing decline in the US Treasury bond yields drags the US Dollar (USD) further away from a nearly three-month top, which, in turn, is seen driving some flows towards the Gold price. In fact, the yield on the benchmark 10-year US government bond is seen extending its pullback from the highest level since November 2007 set last week and keeps the USD bulls on the defensive. That said, rising bets for more interest rate hikes by the Federal Reserve (Fed) should limit the downside for the US bond yields and the USD.
The expectations were reaffirmed by Fed Chair Jerome Powell’s hawkish remarks on Friday, saying that the central bank may need to tighten the monetary policy further to curb sticky inflation. Moreover, a resilient US economy could force the Fed to continue with its rate-hiking cycle for longer. This might hold back bulls from placing aggressive bets around the non-yielding Gold price and warrants caution before positioning for an extension of the recent recovery from the $1,885 region, or the lowest level since March 13.
Traders might also prefer to wait on the sidelines ahead of this week’s key US macro data, including the closely-watched monthly employment details on Friday, which should provide a fresh directional impetus to the Gold price. In the meantime, worries about the worsening economic conditions in China might continue to act as a tailwind for the safe-haven XAU/USD and help limit any corrective decline. Traders now look to the Conference Board US Consumer Confidence Index and JOLTS Job Openings data for short-term opportunities.
Technical Levels: Supports and Resistances
XAUUSD currently trading at 1924.91 at the time of writing. Pair opened at 1920.1 and is trading with a change of 0.25 % .
| Overview | Overview.1 | |
|---|---|---|
| 0 | Today last price | 1924.91 |
| 1 | Today Daily Change | 4.81 |
| 2 | Today Daily Change % | 0.25 |
| 3 | Today daily open | 1920.10 |
The pair is trading above its 20 Daily moving average @ 1914.9, below its 50 Daily moving average @ 1930.14 , below its 100 Daily moving average @ 1957.32 and above its 200 Daily moving average @ 1911.0
| Trends | Trends.1 | |
|---|---|---|
| 0 | Daily SMA20 | 1914.90 |
| 1 | Daily SMA50 | 1930.14 |
| 2 | Daily SMA100 | 1957.32 |
| 3 | Daily SMA200 | 1911.00 |
The previous day high was 1926.14 while the previous day low was 1912.84. The daily 38.2% Fib levels comes at 1921.06, expected to provide support. Similarly, the daily 61.8% fib level is at 1917.92, expected to provide support.
Note the levels of interest below:
- Pivot support is noted at 1913.25, 1906.39, 1899.95
- Pivot resistance is noted at 1926.55, 1932.99, 1939.85
| Levels | Levels.1 |
|---|---|
| Previous Daily High | 1926.14 |
| Previous Daily Low | 1912.84 |
| Previous Weekly High | 1923.43 |
| Previous Weekly Low | 1884.85 |
| Previous Monthly High | 1987.54 |
| Previous Monthly Low | 1902.77 |
| Daily Fibonacci 38.2% | 1921.06 |
| Daily Fibonacci 61.8% | 1917.92 |
| Daily Pivot Point S1 | 1913.25 |
| Daily Pivot Point S2 | 1906.39 |
| Daily Pivot Point S3 | 1899.95 |
| Daily Pivot Point R1 | 1926.55 |
| Daily Pivot Point R2 | 1932.99 |
| Daily Pivot Point R3 | 1939.85 |
[/s2If]
Download Nehcap EAWe have two EAs that are operational on our LIVE accounts.
- EA-FIX: Check out the details here. Download EA-FIX . EA-FIX is a non-grid HFT scalper.
- EA-GROWTH: High quality low dd EA using trend grids. Download EA_GROWTHJoin Our Telegram Group
")


