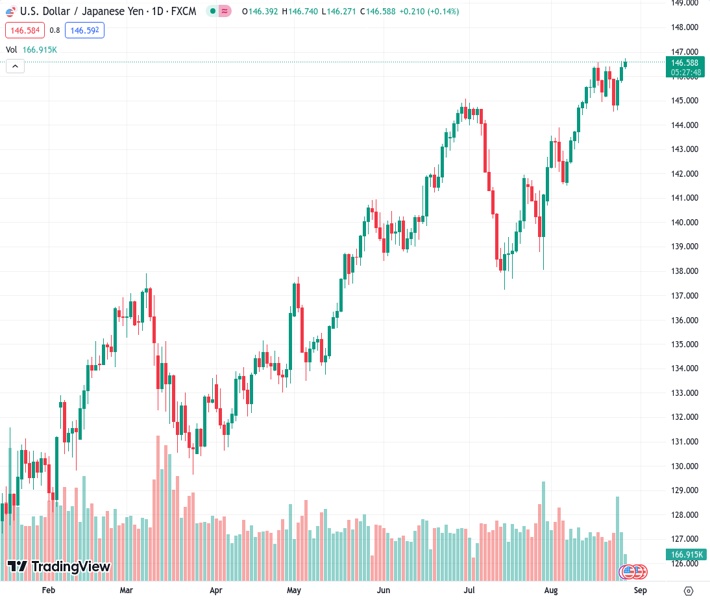
#USDJPY @ 146.606 surges to a new YTD high of 146.68, buoyed by Wall Street’s upbeat opening and dovish comments from BoJ Governor Kazuo Ueda.
…
This is a premium post.
[s2If !current_user_can(access_s2member_level4)]Please register for FREE REGISTER to read full post below containing analysis. In case of any error or you think you are not able to read the full post below, please email us at support#nehcap.com [lwa][/s2If] [s2If current_user_can(access_s2member_level1)]
- USD/JPY surges to a new YTD high of 146.68, buoyed by Wall Street’s upbeat opening and dovish comments from BoJ Governor Kazuo Ueda.
The pair currently trades last at 146.606.
The previous day high was 146.64 while the previous day low was 145.72. The daily 38.2% Fib levels comes at 146.29, expected to provide support. Similarly, the daily 61.8% fib level is at 146.07, expected to provide support.
USD/JPY resumes its uptrend, prints a new year-to-date (YTD) high of 146.68, on an upbeat sentiment, with Wall Street opening the week on a higher note amidst thin liquidity conditions due to the UK’s Summer Bank Holiday. Hence, the Japanese Yen (JPY) extended its losses to three straight sessions spurred by dovish remarks by the Bank of Japan’s (BoJ) Governor Kazuo Ueda. The pair exchanges hands at 146.60.
US equities resumed their uptrend following hawkish remarks by the US Federal Reserve (Fed) Chair Jerome Powell at Jackson Hole. Despite being data-dependent, Powell’s words reinforced the US central bank hawkish stance, which triggered a leg-up in the USD/JPY pair. He added that robust economic expansion and the constrained labor market would warrant further tightening by the Fed if those economic indicators don’t show signs of easing.
The USD/JPY advance stalled as US Treasury bond yields began to lose ground, particularly the US 10-year Treasury Note, with its coupon sliding two basis points at 4.22% and undermining the greenback.
On the Japanese front, the BoJ Governor Kazuo Ueda said that underlying inflation is still below target and justified the current “dovish” monetary policy stance by the BoJ, even though July’s core consumer inflation rose by 3.1%. Ueda added that inflation “is expected to decline.”
Although the BoJ tweaked its Yield Curve Control (YCC) to a 0.50%-1% flexible target, the 10-year Japanese Government Bonds (JGBs) yield has failed to break higher, which could shift the USD/JPY pair bias bearish. Once the BoJ signals it is ready to normalize its monetary policy, the USD/JPY could resume lower after posting gains of 11.85% in the year.
A busy economic calendar could rock the boat in the week ahead. The US docket would feature JOLTs report, the CB Consumer Confidence, the release of the Gross Domestic Product, the Fed’s preferred gauge for inflation, the core PCE, US employment data, and business activity. On the Japanese front, speeches by two BoJ members.
The US Dollar rally against the Japanese Yen is set to continue if not for vocal expressions of Japanese authorities threatening to intervene in the FX markets. After hitting a new YTD high, the USD/JPY could extend its gains towards the November 3 high at 148.45, followed by the October 31 high at 148.84, before piercing 149.00. The major’s downside risks emerge at the Tenkan-Sen line at 145.61. If breached, the next stop would be the August 23 swing low of 144.54.
Technical Levels: Supports and Resistances
USDJPY currently trading at 146.66 at the time of writing. Pair opened at 146.43 and is trading with a change of 0.16 % .
| Overview | Overview.1 | |
|---|---|---|
| 0 | Today last price | 146.66 |
| 1 | Today Daily Change | 0.23 |
| 2 | Today Daily Change % | 0.16 |
| 3 | Today daily open | 146.43 |
The pair remains strongly bullish on the daily timeframe. It trades above its 20 SMA @ 144.53, 50 SMA 142.86, 100 SMA @ 139.89 and 200 SMA @ 136.68.
| Trends | Trends.1 | |
|---|---|---|
| 0 | Daily SMA20 | 144.53 |
| 1 | Daily SMA50 | 142.86 |
| 2 | Daily SMA100 | 139.89 |
| 3 | Daily SMA200 | 136.68 |
The previous day high was 146.64 while the previous day low was 145.72. The daily 38.2% Fib levels comes at 146.29, expected to provide support. Similarly, the daily 61.8% fib level is at 146.07, expected to provide support.
Note the levels of interest below:
- Pivot support is noted at 145.89, 145.35, 144.98
- Pivot resistance is noted at 146.8, 147.18, 147.71
| Levels | Levels.1 |
|---|---|
| Previous Daily High | 146.64 |
| Previous Daily Low | 145.72 |
| Previous Weekly High | 146.64 |
| Previous Weekly Low | 144.54 |
| Previous Monthly High | 144.91 |
| Previous Monthly Low | 137.24 |
| Daily Fibonacci 38.2% | 146.29 |
| Daily Fibonacci 61.8% | 146.07 |
| Daily Pivot Point S1 | 145.89 |
| Daily Pivot Point S2 | 145.35 |
| Daily Pivot Point S3 | 144.98 |
| Daily Pivot Point R1 | 146.80 |
| Daily Pivot Point R2 | 147.18 |
| Daily Pivot Point R3 | 147.71 |
[/s2If]
Download Nehcap EAWe have two EAs that are operational on our LIVE accounts.
- EA-FIX: Check out the details here. Download EA-FIX . EA-FIX is a non-grid HFT scalper.
- EA-GROWTH: High quality low dd EA using trend grids. Download EA_GROWTHJoin Our Telegram Group
")


