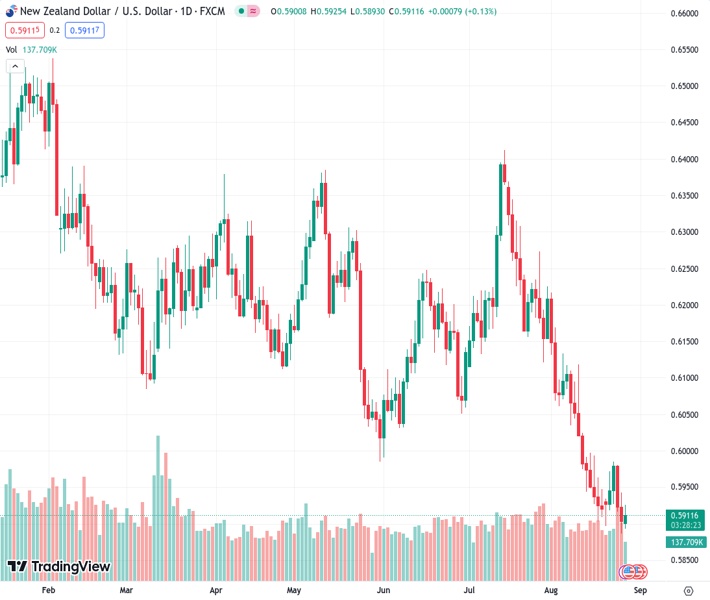
The NZDUSD currency pair, currently at 0.59098, increased and surpassed 0.5900, indicating an increase of approximately 0.20%.
…
This is a premium post.
[s2If !current_user_can(access_s2member_level4)]Please register for FREE REGISTER to read full post below containing analysis. In case of any error or you think you are not able to read the full post below, please email us at support#nehcap.com [lwa][/s2If] [s2If current_user_can(access_s2member_level1)]
- NZD/USD rose back above 0.5900, displaying nearly 0.20% gains.
The pair currently trades last at 0.59098.
The previous day high was 0.5943 while the previous day low was 0.5885. The daily 38.2% Fib levels comes at 0.5907, expected to provide support. Similarly, the daily 61.8% fib level is at 0.5921, expected to provide resistance.
On Monday, the NZD/USD gained traction and rose above 0.5900. No relevant data was released for the US and New Zealand and the upward momentum can be explained by the USD slightly retreating against its rivals, consolidating Thursday and Friday’s gains.
Markets are still assessing Jerome Powell’s words on Friday. He didn’t commit to another hike and addressed that the monetary policy is still data-dependant and the data justifies another hike. In addition, he stated that the economy hasn’t cooled down as expected and that they will retain rates at restrictive levels until inflation shows signs of deceleration.
All eyes are now on the US economic calendar releases this week, which include mid and high-tier labour market figures, including JOLTs Job Openings figures from July and ADP Employment Change and Nonfarm Payrolls from August. In addition, Gross Domestic Product (GDP), ISM PMI and Core Personal Consumption Expenditures (PCE) will also be closely watched for investors to model their expectations for the next Fed meetings.
In the meantime, according to the CME FedWatch tool, the odds of a hike in September are still low, but the probabilities increased nearly 50% for the November meeting.
Based on the daily chart, it is evident that NZD/USD leans toward a bearish outlook in the short term. The Relative Strength Index (RSI) remains below its midline, deep in negative territory, showcasing a neutral slope near the oversold threshold. Similarly, the Moving Average Convergence Divergence (MACD) exhibits red bars, emphasizing the strengthening bearish momentum for NZD/USD. Also, the pair is below the 20,100 and 200-day Simple Moving Averages (SMAs), indicating a challenging position for the buyers in the bigger picture as the bears remain in command.
Support levels: 0.5900, 0.5870, 0.5850.
Resistance levels: 0.5940, 0.5950, 0.5980.
Technical Levels: Supports and Resistances
NZDUSD currently trading at 0.5909 at the time of writing. Pair opened at 0.5903 and is trading with a change of 0.1 % .
| Overview | Overview.1 | |
|---|---|---|
| 0 | Today last price | 0.5909 |
| 1 | Today Daily Change | 0.0006 |
| 2 | Today Daily Change % | 0.1000 |
| 3 | Today daily open | 0.5903 |
The pair remains strongly bearish on the daily time frame. It trades below the 20 SMA @ 0.6011, 50 SMA 0.6125, 100 SMA @ 0.6152 and 200 SMA @ 0.6227.
| Trends | Trends.1 | |
|---|---|---|
| 0 | Daily SMA20 | 0.6011 |
| 1 | Daily SMA50 | 0.6125 |
| 2 | Daily SMA100 | 0.6152 |
| 3 | Daily SMA200 | 0.6227 |
The previous day high was 0.5943 while the previous day low was 0.5885. The daily 38.2% Fib levels comes at 0.5907, expected to provide support. Similarly, the daily 61.8% fib level is at 0.5921, expected to provide resistance.
Note the levels of interest below:
- Pivot support is noted at 0.5878, 0.5852, 0.582
- Pivot resistance is noted at 0.5936, 0.5968, 0.5994
| Levels | Levels.1 |
|---|---|
| Previous Daily High | 0.5943 |
| Previous Daily Low | 0.5885 |
| Previous Weekly High | 0.5987 |
| Previous Weekly Low | 0.5885 |
| Previous Monthly High | 0.6413 |
| Previous Monthly Low | 0.6120 |
| Daily Fibonacci 38.2% | 0.5907 |
| Daily Fibonacci 61.8% | 0.5921 |
| Daily Pivot Point S1 | 0.5878 |
| Daily Pivot Point S2 | 0.5852 |
| Daily Pivot Point S3 | 0.5820 |
| Daily Pivot Point R1 | 0.5936 |
| Daily Pivot Point R2 | 0.5968 |
| Daily Pivot Point R3 | 0.5994 |
[/s2If]
Download Nehcap EAWe have two EAs that are operational on our LIVE accounts.
- EA-FIX: Check out the details here. Download EA-FIX . EA-FIX is a non-grid HFT scalper.
- EA-GROWTH: High quality low dd EA using trend grids. Download EA_GROWTHJoin Our Telegram Group
")


