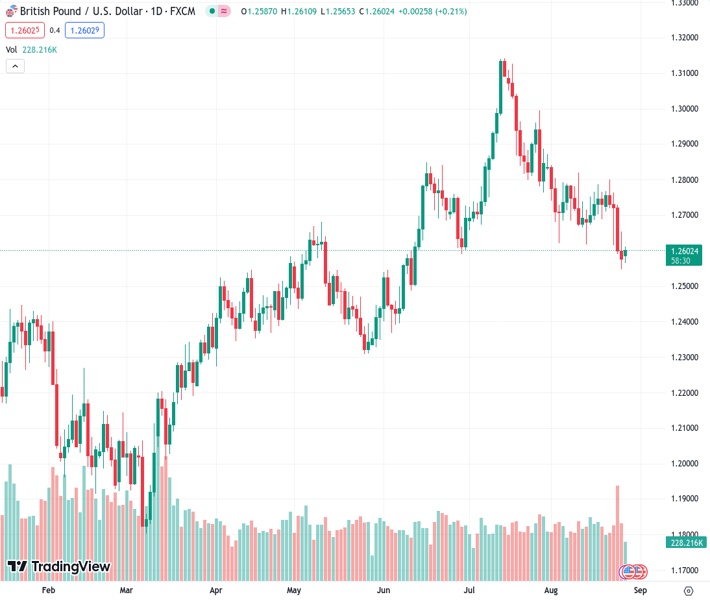
The GBPUSD currency pair is currently trading at 1.2601, which is a 0.19% increase from the previous value of 1.26034. The Pound has received some temporary relief due to the UK Summer Bank Holiday and decreasing US bond yields.
…
This is a premium post.
[s2If !current_user_can(access_s2member_level4)]Please register for FREE REGISTER to read full post below containing analysis. In case of any error or you think you are not able to read the full post below, please email us at support#nehcap.com [lwa][/s2If] [s2If current_user_can(access_s2member_level1)]
- GBP/USD trades at 1.2601, up 0.19%, as a UK Summer Bank Holiday and falling US bond yields offer temporary relief to the beleaguered Pound.
The pair currently trades last at 1.26034.
The previous day high was 1.2655 while the previous day low was 1.2548. The daily 38.2% Fib levels comes at 1.2589, expected to provide support. Similarly, the daily 61.8% fib level is at 1.2614, expected to provide resistance.
The British Pound (GBP) stopped its free-fall on Monday against the US Dollar (USD) amidst a UK Summer Bank Holiday, which spurred choppy trading amongst most FX pairs during the overlap of the London-New York session. At the time of writing, the GBP/USD is trading at 1.2601, gaining 0.19%.
The current week presents a busy US economic docket, contrary to the UK. On the latter, if not for a speech of the Bank of England (BoE) Chief Economist Huw Pill and the release of housing prices, the GBP/USD fate would lie mainly on the US Dollar dynamics.
However, Monday’s price action was mainly driven by a risk-on impulse, which weighed on global bond yields, particularly in the United States (US). US bond yields tumbled across the board, undermining the greenback, as shown by the US Dollar Index (DXY), a basket of six currencies that measures their performance against the buck, dropped 0.12%, down at 104.060.
Nevertheless, last week’s Jackson Hole speech by the US Federal Reserve (Fed) Chair Jerome Powell was seen as hawkish, as he emphasized the Fed’s commitment to tackle inflation, justifying higher rates if growth continues to be above trend, while the labor market remains tight. He added the US central bank is still data-dependent, noting they would proceed “carefully” when deciding regarding momentary policy.
Following Powell’s remarks, money market futures are confident the Fed will skip a rate hike in September. Nonetheless, for November, the story is different, with traders expecting a 25 bps rate hike, as shown by odds close to 50%, as shown by the CME FedWatch Tool.
Given the backdrop, the GBP/USD pair could resume its downtrend based on the latest data. However, a busy US economic docket could weaken the greenback. On Tuesday, jobs data, consumer confidence, and housing data could ignite volatility in the pair. Any surprises that justify further tightening can pave the way for further US Dollar strength and Sterling (GBP) weakness.
After falling below the August 3 low of 1.2620, the GBP/USD extended its losses below the 1.2600 figure but hovers around the latter as of writing. From a market structure perspective, the pair has achieved successive lower lows, opening the door for a bearish continuation. If the pair achieves a daily close above 1.2600, the pair could test last Friday’s high of 1.2654. Otherwise, the major would resume its downtrend toward the 1.2500 figure, followed by the 200-day Moving Average (DMA) at 1.2401.
Technical Levels: Supports and Resistances
GBPUSD currently trading at 1.2603 at the time of writing. Pair opened at 1.258 and is trading with a change of 0.18 % .
| Overview | Overview.1 | |
|---|---|---|
| 0 | Today last price | 1.2603 |
| 1 | Today Daily Change | 0.0023 |
| 2 | Today Daily Change % | 0.1800 |
| 3 | Today daily open | 1.2580 |
The pair is trading below its 20 Daily moving average @ 1.272, below its 50 Daily moving average @ 1.2788 , below its 100 Daily moving average @ 1.264 and above its 200 Daily moving average @ 1.24
| Trends | Trends.1 | |
|---|---|---|
| 0 | Daily SMA20 | 1.2720 |
| 1 | Daily SMA50 | 1.2788 |
| 2 | Daily SMA100 | 1.2640 |
| 3 | Daily SMA200 | 1.2400 |
The previous day high was 1.2655 while the previous day low was 1.2548. The daily 38.2% Fib levels comes at 1.2589, expected to provide support. Similarly, the daily 61.8% fib level is at 1.2614, expected to provide resistance.
Note the levels of interest below:
- Pivot support is noted at 1.2534, 1.2488, 1.2427
- Pivot resistance is noted at 1.2641, 1.2701, 1.2747
| Levels | Levels.1 |
|---|---|
| Previous Daily High | 1.2655 |
| Previous Daily Low | 1.2548 |
| Previous Weekly High | 1.2800 |
| Previous Weekly Low | 1.2548 |
| Previous Monthly High | 1.3142 |
| Previous Monthly Low | 1.2659 |
| Daily Fibonacci 38.2% | 1.2589 |
| Daily Fibonacci 61.8% | 1.2614 |
| Daily Pivot Point S1 | 1.2534 |
| Daily Pivot Point S2 | 1.2488 |
| Daily Pivot Point S3 | 1.2427 |
| Daily Pivot Point R1 | 1.2641 |
| Daily Pivot Point R2 | 1.2701 |
| Daily Pivot Point R3 | 1.2747 |
[/s2If]
Download Nehcap EAWe have two EAs that are operational on our LIVE accounts.
- EA-FIX: Check out the details here. Download EA-FIX . EA-FIX is a non-grid HFT scalper.
- EA-GROWTH: High quality low dd EA using trend grids. Download EA_GROWTHJoin Our Telegram Group
")


