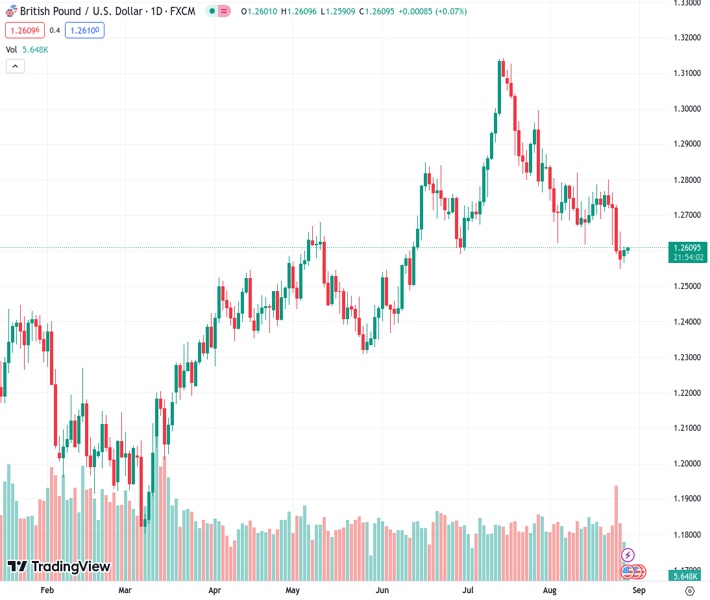
The GBP/USD currency pair, currently trading at 1.26090, is defending a modest recovery from its lowest point in 11 weeks and has been experiencing slight upward movement recently. However, according to the view of Nehcap, there is not much potential for significant upward movement in the near future.
…
This is a premium post.
[s2If !current_user_can(access_s2member_level4)]Please register for FREE REGISTER to read full post below containing analysis. In case of any error or you think you are not able to read the full post below, please email us at support#nehcap.com [lwa][/s2If] [s2If current_user_can(access_s2member_level1)]
- GBP/USD defends corrective bounce off 11-week low, edges higher of late.
The pair currently trades last at 1.26090.
The previous day high was 1.2655 while the previous day low was 1.2548. The daily 38.2% Fib levels comes at 1.2589, expected to provide support. Similarly, the daily 61.8% fib level is at 1.2614, expected to provide resistance.
GBP/USD grinds higher past 1.2600 after an upbeat start of the week, picking up bids near 1.2610 amid early Tuesday morning in Asia. In doing so, the Cable pair extends the late Friday’s corrective bounce off a three-month-old horizontal support zone towards the previously key technical supports.
That said, a convergence of the 61.8% Fibonacci retracement of the May-July upside and the previous support line from late June, around 1.2630 at the latest, restricts immediate recovery of the Pound Sterling buyers, especially amid the bearish MACD signals.
Even if the quote manages to cross the 1.2630 upside hurdle, the 100-DMA and 21-DMA will challenge the GBP/USD buyers respectively around 1.2645 and 1.2705.
In a case where the Cable pair remains firmer past 1.2705, a downward-sloping resistance line from mid-July, around 1. 2740 by the press time, will be crucial to watch for the bulls before taking control.
On the flip side, the aforementioned horizontal support zone comprising multiple levels marked since early June, close to 1.2550–35, will be crucial to keep the GBP/USD buyers hopeful.
Should the Pound Sterling remain bearish past 1.2535, the odds of witnessing a slump towards May’s monthly bottom of around 1.2300 can’t be ruled out.
Overall, GBP/USD remains on the bear’s radar event if the short-term recovery can’t be ruled out.
Trend: Limited upside expected
Technical Levels: Supports and Resistances
GBPUSD currently trading at 1.2607 at the time of writing. Pair opened at 1.258 and is trading with a change of 0.21% % .
| Overview | Overview.1 | |
|---|---|---|
| 0 | Today last price | 1.2607 |
| 1 | Today Daily Change | 0.0027 |
| 2 | Today Daily Change % | 0.21% |
| 3 | Today daily open | 1.258 |
The pair is trading below its 20 Daily moving average @ 1.272, below its 50 Daily moving average @ 1.2788 , below its 100 Daily moving average @ 1.264 and above its 200 Daily moving average @ 1.24
| Trends | Trends.1 | |
|---|---|---|
| 0 | Daily SMA20 | 1.2720 |
| 1 | Daily SMA50 | 1.2788 |
| 2 | Daily SMA100 | 1.2640 |
| 3 | Daily SMA200 | 1.2400 |
The previous day high was 1.2655 while the previous day low was 1.2548. The daily 38.2% Fib levels comes at 1.2589, expected to provide support. Similarly, the daily 61.8% fib level is at 1.2614, expected to provide resistance.
Note the levels of interest below:
- Pivot support is noted at 1.2534, 1.2488, 1.2427
- Pivot resistance is noted at 1.2641, 1.2701, 1.2747
| Levels | Levels.1 |
|---|---|
| Previous Daily High | 1.2655 |
| Previous Daily Low | 1.2548 |
| Previous Weekly High | 1.2800 |
| Previous Weekly Low | 1.2548 |
| Previous Monthly High | 1.3142 |
| Previous Monthly Low | 1.2659 |
| Daily Fibonacci 38.2% | 1.2589 |
| Daily Fibonacci 61.8% | 1.2614 |
| Daily Pivot Point S1 | 1.2534 |
| Daily Pivot Point S2 | 1.2488 |
| Daily Pivot Point S3 | 1.2427 |
| Daily Pivot Point R1 | 1.2641 |
| Daily Pivot Point R2 | 1.2701 |
| Daily Pivot Point R3 | 1.2747 |
[/s2If]
Download Nehcap EAWe have two EAs that are operational on our LIVE accounts.
- EA-FIX: Check out the details here. Download EA-FIX . EA-FIX is a non-grid HFT scalper.
- EA-GROWTH: High quality low dd EA using trend grids. Download EA_GROWTHJoin Our Telegram Group
")


