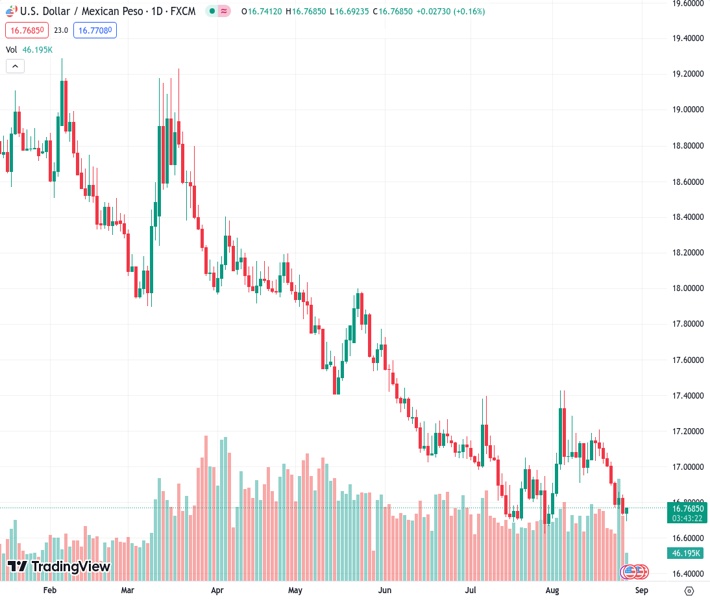
The exchange rate between the US dollar and the Mexican peso is currently at 16.7187, a decrease of 0.13% from the rate of 16.7610. This decline is attributed to the Mexican peso benefiting from the difference in interest rates and the optimistic outlook of the Bank of Mexico (Banxico).
…
This is a premium post.
[s2If !current_user_can(access_s2member_level4)]Please register for FREE REGISTER to read full post below containing analysis. In case of any error or you think you are not able to read the full post below, please email us at support#nehcap.com [lwa][/s2If] [s2If current_user_can(access_s2member_level1)]
- USD/MXN trades at 16.7187, down 0.13%, as the Mexican Peso capitalizes on interest rate differentials and Banxico’s hawkish outlook.
The pair currently trades last at 16.7610.
The previous day high was 16.8457 while the previous day low was 16.7366. The daily 38.2% Fib levels comes at 16.7783, expected to provide resistance. Similarly, the daily 61.8% fib level is at 16.804, expected to provide resistance.
The Mexican Peso (MXN) resumed its gains against the US Dollar (USD) due to the interest rate differential of the former against the greenback, despite last Friday’s hawkish remarks by the US Federal Reserve Chair Jerome Powell. The USD/MXN is eyeing a fall to test the year-to-date (YTD) low of 16.6238, but it trades at 16.7187, down 0.13%.
US equities depict investors’ positive mood amid an absent US economic calendar. Last week’s Fed Chair Jerome Powell’s speech weighed on the USD/MXN, though by the end of the New York session, the MXN extended its gains. The US Dollar Index, a gauge of the buck’s value against a basket of six currencies, drops to its daily low at 103.977, a headwind for the USD/MXN.
The Fed Chair Jerome Powell said that despite two good reports on inflation, it would be appropriate to tighten monetary policy and that they would proceed “carefully” when choosing to hike rates or stay put. Powell states they would remain data-dependant and warranted additional hikes if growth and employment remained solid.
Developments in the Asian session witnessed China’s delivering stimulus amidst its troubled property sector and its equity markets. That spurred a risk-on response, though stocks remained pressured as global central banks would likely continue to tighten monetary conditions.
The Bank of Mexico (Banxico) policymakers remain hawkish on the Mexican front, as the latest meeting minutes revealed. Even though headline inflation continued to decelerate to 4.67% in August, the Mexican central bank would remain “cautious” given the inflationary outlook, with one member highlighting that Banxico could remain on hold for the rest of 2023.
In the week ahead, the Mexican economic agenda will deliver growth figures for the second quarter on Tuesday. The US docket will reveal Home prices, JOLTs Jobs Opening, and the CB Consumer Confidence indicator.
The pair remains downward biased, as the 20-day Simple Moving Average (SMA) turned flat, though it remains above the 50-day SMA. With the USD/MXN managing to print successive series of lower lows, the YTD low of 16.6238 could be tested in the near term, followed by the October 2015 daily low of 16.3267. Contrarily, the USD/MXN could shift bullish if it reclaims the 17.0000 figure.
Technical Levels: Supports and Resistances
USDMXN currently trading at 16.7352 at the time of writing. Pair opened at 16.7539 and is trading with a change of -0.11 % .
| Overview | Overview.1 | |
|---|---|---|
| 0 | Today last price | 16.7352 |
| 1 | Today Daily Change | -0.0187 |
| 2 | Today Daily Change % | -0.1100 |
| 3 | Today daily open | 16.7539 |
The pair remains strongly bearish on the daily time frame. It trades below the 20 SMA @ 17.0124, 50 SMA 16.9984, 100 SMA @ 17.3649 and 200 SMA @ 18.1276.
| Trends | Trends.1 | |
|---|---|---|
| 0 | Daily SMA20 | 17.0124 |
| 1 | Daily SMA50 | 16.9984 |
| 2 | Daily SMA100 | 17.3649 |
| 3 | Daily SMA200 | 18.1276 |
The previous day high was 16.8457 while the previous day low was 16.7366. The daily 38.2% Fib levels comes at 16.7783, expected to provide resistance. Similarly, the daily 61.8% fib level is at 16.804, expected to provide resistance.
Note the levels of interest below:
- Pivot support is noted at 16.7118, 16.6697, 16.6028
- Pivot resistance is noted at 16.8208, 16.8878, 16.9299
| Levels | Levels.1 |
|---|---|
| Previous Daily High | 16.8457 |
| Previous Daily Low | 16.7366 |
| Previous Weekly High | 17.0800 |
| Previous Weekly Low | 16.7366 |
| Previous Monthly High | 17.3957 |
| Previous Monthly Low | 16.6258 |
| Daily Fibonacci 38.2% | 16.7783 |
| Daily Fibonacci 61.8% | 16.8040 |
| Daily Pivot Point S1 | 16.7118 |
| Daily Pivot Point S2 | 16.6697 |
| Daily Pivot Point S3 | 16.6028 |
| Daily Pivot Point R1 | 16.8208 |
| Daily Pivot Point R2 | 16.8878 |
| Daily Pivot Point R3 | 16.9299 |
[/s2If]
Download Nehcap EAWe have two EAs that are operational on our LIVE accounts.
- EA-FIX: Check out the details here. Download EA-FIX . EA-FIX is a non-grid HFT scalper.
- EA-GROWTH: High quality low dd EA using trend grids. Download EA_GROWTHJoin Our Telegram Group
")


