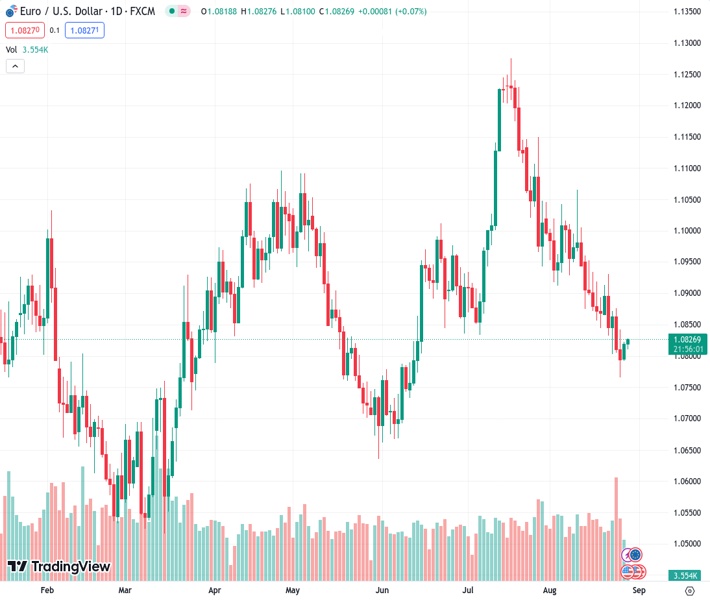
The EURUSD pair, currently trading at 1.08268, has slightly increased in value following a decline over the past two days. This uptick comes after reaching its lowest point in 11 weeks.
…
This is a premium post.
[s2If !current_user_can(access_s2member_level4)]Please register for FREE REGISTER to read full post below containing analysis. In case of any error or you think you are not able to read the full post below, please email us at support#nehcap.com [lwa][/s2If] [s2If current_user_can(access_s2member_level1)]
- EUR/USD edges higher after snapping two-day downtrend at 11-week low.
The pair currently trades last at 1.08268.
The previous day high was 1.0842 while the previous day low was 1.0766. The daily 38.2% Fib levels comes at 1.0795, expected to provide support. Similarly, the daily 61.8% fib level is at 1.0813, expected to provide support.
EUR/USD holds onto the week-start recovery gains around 1.0820 during the early hours of Tuesday’s Asian session. In doing so, the Euro pair cheers the US Dollar’s pullback while tracing the downbeat Treasury bond yields. It’s worth noting, however, that the mixed concerns about Germany and cautious mood ahead of this week’s top-tier inflation and employment data from the US and Eurozone checks the pair buyers.
US Dollar Index (DXY) dropped on Monday after posting the six-week uptrend even as the United States mid-tier activity data improves. That said, the US 10-year Treasury bond yields dropped three basis points (bps) to 4.20% and the two-year counterpart declined half a percent to 5.5% at the latest.
On Monday, Germany’s highly influential IFO institute published a survey of exporters and cited the deteriorating morale in August due to weak global demand. The poll also mentioned, “More and more companies are also complaining about being less able to compete at the global level.”
On the contrary, French Finance Minister Bruno Le Maire ruled out any reduction in interest rates in the coming months. The policymaker also said, “We also need to address inflation pressure in the services sector.”
It should be noted that the US Dallas Fed Manufacturing Business Index improved to -17.2 for August versus -21.6 expected and -20.0 prior. It’s worth noting that the details of the activity gauge were mixed as the new orders and prices paid for raw materials increased but the finished goods prices eased.
Above all, the improvement in the market’s sentiment, mainly backed by China, joined the Fed officials’ inability to please markets with major hawkish surprise seem to weigh on the US Treasury bond yields and the Greenback. However, looming economic concerns about the Old Continent keep the EUR/USD bears hopeful as the top-tier inflation numbers from the bloc and the US for August loom, together with the US employment report.
Moving on, Germany’s GfK Consumer Confidence Survey for September will become the immediate catalyst for the EUR/USD pair and may please the buyers in a case of matching the -24.3 expectations, versus -24.4 prior. Following that, the US Conference Board’s (CB) Consumer Confidence Index for August, expected at 116.2 versus prior 117.00, will entertain the intraday traders.
A convergence of the 13-day-old falling resistance line and the 10-day SMA, around 1.0850 by the press time, restricts the immediate upside of the EUR/USD pair even as the nearly oversold RSI conditions lure the buyers.
Technical Levels: Supports and Resistances
EURUSD currently trading at 1.0824 at the time of writing. Pair opened at 1.0796 and is trading with a change of 0.26% % .
| Overview | Overview.1 | |
|---|---|---|
| 0 | Today last price | 1.0824 |
| 1 | Today Daily Change | 0.0028 |
| 2 | Today Daily Change % | 0.26% |
| 3 | Today daily open | 1.0796 |
The pair is trading below its 20 Daily moving average @ 1.0919, below its 50 Daily moving average @ 1.0977 , below its 100 Daily moving average @ 1.0928 and above its 200 Daily moving average @ 1.0804
| Trends | Trends.1 | |
|---|---|---|
| 0 | Daily SMA20 | 1.0919 |
| 1 | Daily SMA50 | 1.0977 |
| 2 | Daily SMA100 | 1.0928 |
| 3 | Daily SMA200 | 1.0804 |
The previous day high was 1.0842 while the previous day low was 1.0766. The daily 38.2% Fib levels comes at 1.0795, expected to provide support. Similarly, the daily 61.8% fib level is at 1.0813, expected to provide support.
Note the levels of interest below:
- Pivot support is noted at 1.0761, 1.0725, 1.0685
- Pivot resistance is noted at 1.0836, 1.0877, 1.0912
| Levels | Levels.1 |
|---|---|
| Previous Daily High | 1.0842 |
| Previous Daily Low | 1.0766 |
| Previous Weekly High | 1.0930 |
| Previous Weekly Low | 1.0766 |
| Previous Monthly High | 1.1276 |
| Previous Monthly Low | 1.0834 |
| Daily Fibonacci 38.2% | 1.0795 |
| Daily Fibonacci 61.8% | 1.0813 |
| Daily Pivot Point S1 | 1.0761 |
| Daily Pivot Point S2 | 1.0725 |
| Daily Pivot Point S3 | 1.0685 |
| Daily Pivot Point R1 | 1.0836 |
| Daily Pivot Point R2 | 1.0877 |
| Daily Pivot Point R3 | 1.0912 |
[/s2If]
Download Nehcap EAWe have two EAs that are operational on our LIVE accounts.
- EA-FIX: Check out the details here. Download EA-FIX . EA-FIX is a non-grid HFT scalper.
- EA-GROWTH: High quality low dd EA using trend grids. Download EA_GROWTHJoin Our Telegram Group
")


