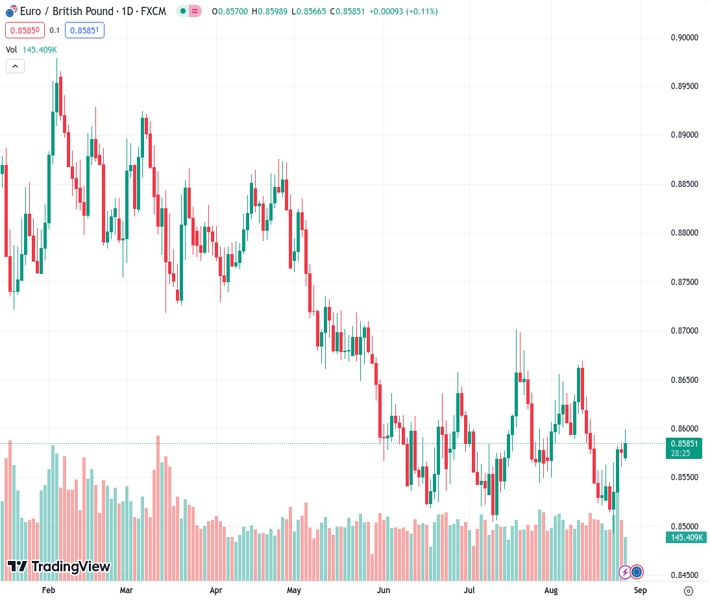
The EURGBP currency pair, currently trading at 0.85852, is now at 0.8585, and it is currently testing the 50-day Moving Average at 0.8583. If it closes above this level, it could potentially aim for the 0.8600 mark.
…
This is a premium post.
[s2If !current_user_can(access_s2member_level4)]Please register for FREE REGISTER to read full post below containing analysis. In case of any error or you think you are not able to read the full post below, please email us at support#nehcap.com [lwa][/s2If] [s2If current_user_can(access_s2member_level1)]
- EUR/GBP trades at 0.8585, testing the 50-day Moving Average at 0.8583, with a daily close above potentially targeting the 0.8600 level.
The pair currently trades last at 0.85852.
The previous day high was 0.8586 while the previous day low was 0.856. The daily 38.2% Fib levels comes at 0.8576, expected to provide support. Similarly, the daily 61.8% fib level is at 0.857, expected to provide support.
EUR/GBP climbed late in the New York session to gains above 0.8550, courtesy of a risk-on impulse and technical indicator, suggesting further upside is expected amid the lack of economic data on the UK calendar. The pair is trading at 0.8585, gains 0.11%.
The cross-currency daily chart portrays the pair as neutral to downward biased, as the pair resumed upwards and is testing the 50-day Moving Average (DMA) at 0.8583. A daily close above the latter would expose the 0.8600 figure, followed by the August 14 high of 0.8632. Otherwise, if EUR/GBP stays below 0.8600, that could open the door for further weakness, and it might test the year-to-date (YTD) low of 0.8492.
The EUR/GBP hourly chart depicts the pair as upward biased, with the pair achieving successive series of higher lows and higher highs, which could pave the way for further upside. If EUR/GBP breaks above 0.8600, that could open the door for further gains, with the August 14 high at 0.8632 and the August 11 high at 0.8669. Conversely, if sellers break the 50-hour Simple Moving Average (SMA) ah 0.8579, a pullback is expected towards Monday’s low of 0.8566. A breach of the latter would expose last Friday’s low of 0.8560.
Technical Levels: Supports and Resistances
EURGBP currently trading at 0.8584 at the time of writing. Pair opened at 0.8581 and is trading with a change of 0.03 % .
| Overview | Overview.1 | |
|---|---|---|
| 0 | Today last price | 0.8584 |
| 1 | Today Daily Change | 0.0003 |
| 2 | Today Daily Change % | 0.0300 |
| 3 | Today daily open | 0.8581 |
The pair remains strongly bearish on the daily time frame. It trades below the 20 SMA @ 0.8584, 50 SMA 0.8584, 100 SMA @ 0.8647 and 200 SMA @ 0.8715.
| Trends | Trends.1 | |
|---|---|---|
| 0 | Daily SMA20 | 0.8584 |
| 1 | Daily SMA50 | 0.8584 |
| 2 | Daily SMA100 | 0.8647 |
| 3 | Daily SMA200 | 0.8715 |
The previous day high was 0.8586 while the previous day low was 0.856. The daily 38.2% Fib levels comes at 0.8576, expected to provide support. Similarly, the daily 61.8% fib level is at 0.857, expected to provide support.
Note the levels of interest below:
- Pivot support is noted at 0.8566, 0.8551, 0.8541
- Pivot resistance is noted at 0.8591, 0.8601, 0.8616
| Levels | Levels.1 |
|---|---|
| Previous Daily High | 0.8586 |
| Previous Daily Low | 0.8560 |
| Previous Weekly High | 0.8586 |
| Previous Weekly Low | 0.8493 |
| Previous Monthly High | 0.8701 |
| Previous Monthly Low | 0.8504 |
| Daily Fibonacci 38.2% | 0.8576 |
| Daily Fibonacci 61.8% | 0.8570 |
| Daily Pivot Point S1 | 0.8566 |
| Daily Pivot Point S2 | 0.8551 |
| Daily Pivot Point S3 | 0.8541 |
| Daily Pivot Point R1 | 0.8591 |
| Daily Pivot Point R2 | 0.8601 |
| Daily Pivot Point R3 | 0.8616 |
[/s2If]
Download Nehcap EAWe have two EAs that are operational on our LIVE accounts.
- EA-FIX: Check out the details here. Download EA-FIX . EA-FIX is a non-grid HFT scalper.
- EA-GROWTH: High quality low dd EA using trend grids. Download EA_GROWTHJoin Our Telegram Group
")


