The consolidation of the USDCAD currency pair at 1.36000 can be attributed to the positive advancement in crude oil prices.
…
This is a premium post.
[s2If !current_user_can(access_s2member_level4)]Please register for FREE REGISTER to read full post below containing analysis. In case of any error or you think you are not able to read the full post below, please email us at support#nehcap.com [lwa][/s2If] [s2If current_user_can(access_s2member_level1)]
- USD/CAD consolidates due to improved prices of Crude oil.
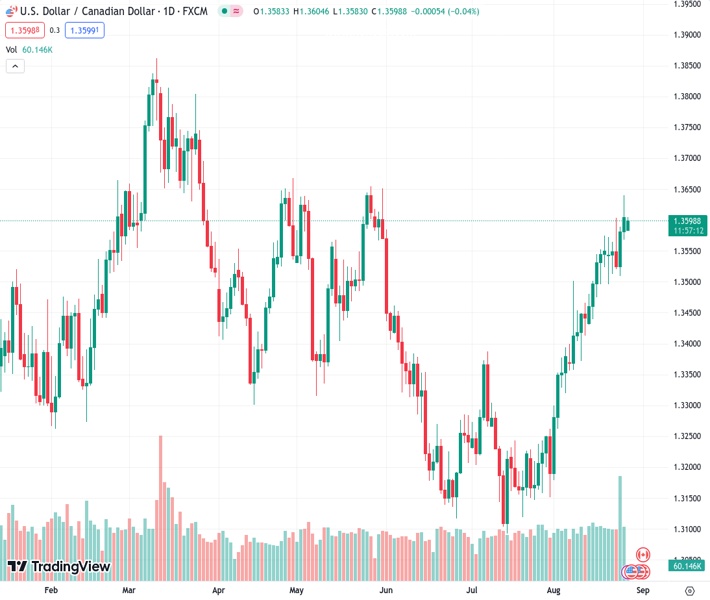
The pair currently trades last at 1.36000.
The previous day high was 1.364 while the previous day low was 1.3569. The daily 38.2% Fib levels comes at 1.3613, expected to provide resistance. Similarly, the daily 61.8% fib level is at 1.3596, expected to provide support.
USD/CAD holds ground near 1.3600 to continue its winning streak, during the early hours of the European session on Monday. The pair is experiencing downward pressure due to the retreating US Dollar (DXY) along with the improved prices of WTI crude oil amid optimistic market sentiment ahead of the top-tier economic data releases later in the week including United States (US) Core Personal Consumption Expenditures (PCE) Index, the weekly Jobless Claims, Nonfarm Payrolls and Canada’s Gross Domestic Product (GDP).
Beijing took the step of reducing the stamp duty on stock trading by 0.1%, a move that contributed to the positive trajectory of Crude oil prices. Prior to this, investors had seen Beijing’s previous efforts to stimulate the economy as somewhat ineffective. As a result, there was a call for the Chinese authorities to implement more targeted fiscal measures that align with the country’s economic circumstances.
The WTI Crude oil trades around $80.50 at the time of writing. The Oil buyers currently focus on the four-day visit of US Commerce Secretary Gina Raimondo to Beijing. The primary aim of this visit is to enhance business ties between the United States and China.
The US Dollar Index (DXY), which tracks the Greenback against a basket of currencies, trades around 104.10 just below its highest level in more than two months. The retreating US Treasury yields are undermining the US Dollar (USD) due to the cautious mood after the US Federal Reserve (Fed) Chairman Jerome Powell advocated for supporting “higher for longer” interest rates.
Powell also highlighted that there is still a substantial amount of progress needed to attain price stability. Given the prevailing economic uncertainty, he emphasized the necessity for flexible and agile decision-making in shaping monetary policy.
Technical Levels: Supports and Resistances
USDCAD currently trading at 1.36 at the time of writing. Pair opened at 1.3601 and is trading with a change of -0.01 % .
| Overview | Overview.1 | |
|---|---|---|
| 0 | Today last price | 1.3600 |
| 1 | Today Daily Change | -0.0001 |
| 2 | Today Daily Change % | -0.0100 |
| 3 | Today daily open | 1.3601 |
The pair remains strongly bullish on the daily timeframe. It trades above its 20 SMA @ 1.3452, 50 SMA 1.3309, 100 SMA @ 1.3389 and 200 SMA @ 1.3459.
| Trends | Trends.1 | |
|---|---|---|
| 0 | Daily SMA20 | 1.3452 |
| 1 | Daily SMA50 | 1.3309 |
| 2 | Daily SMA100 | 1.3389 |
| 3 | Daily SMA200 | 1.3459 |
The previous day high was 1.364 while the previous day low was 1.3569. The daily 38.2% Fib levels comes at 1.3613, expected to provide resistance. Similarly, the daily 61.8% fib level is at 1.3596, expected to provide support.
Note the levels of interest below:
- Pivot support is noted at 1.3567, 1.3533, 1.3496
- Pivot resistance is noted at 1.3638, 1.3674, 1.3709
| Levels | Levels.1 |
|---|---|
| Previous Daily High | 1.3640 |
| Previous Daily Low | 1.3569 |
| Previous Weekly High | 1.3640 |
| Previous Weekly Low | 1.3496 |
| Previous Monthly High | 1.3387 |
| Previous Monthly Low | 1.3093 |
| Daily Fibonacci 38.2% | 1.3613 |
| Daily Fibonacci 61.8% | 1.3596 |
| Daily Pivot Point S1 | 1.3567 |
| Daily Pivot Point S2 | 1.3533 |
| Daily Pivot Point S3 | 1.3496 |
| Daily Pivot Point R1 | 1.3638 |
| Daily Pivot Point R2 | 1.3674 |
| Daily Pivot Point R3 | 1.3709 |
[/s2If]
Download Nehcap EAWe have two EAs that are operational on our LIVE accounts.
- EA-FIX: Check out the details here. Download EA-FIX . EA-FIX is a non-grid HFT scalper.
- EA-GROWTH: High quality low dd EA using trend grids. Download EA_GROWTHJoin Our Telegram Group
")


