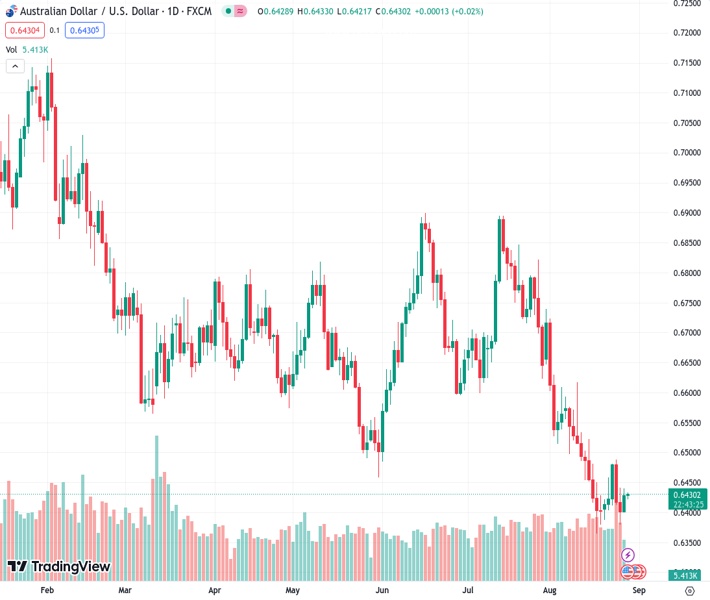
The AUDUSD pair, currently at 0.64293, is holding its rebound from the start of the week after breaking a two-day losing streak.
…
This is a premium post.
[s2If !current_user_can(access_s2member_level4)]Please register for FREE REGISTER to read full post below containing analysis. In case of any error or you think you are not able to read the full post below, please email us at support#nehcap.com [lwa][/s2If] [s2If current_user_can(access_s2member_level1)]
- AUD/USD defends week-start rebound after snapping two-day losing streak.
The pair currently trades last at 0.64293.
The previous day high was 0.6442 while the previous day low was 0.638. The daily 38.2% Fib levels comes at 0.6403, expected to provide support. Similarly, the daily 61.8% fib level is at 0.6418, expected to provide support.
AUD/USD edges higher past 0.6400 after a positive start of the week despite a quiet Monday. That said, the Aussie pair managed to cheer China-inspired optimism and a pullback in the US Treasury bond yields, as well as the upbeat Australia’s Retail Sales, the previous day. However, the cautious mood ahead of Reserve Bank of Australia (RBA) Deputy Governor Michele Bullock, to be the Governor in three weeks, prods the traders of the risk-barometer pair during early Tuesday in Asia.
China’s halving of the stamp duty on stock trading joined a Wall Street Journal (WSJ) piece suggesting Chinese Communist Party Chairman Xi Jinping’s indirect push for stimulus to favor market sentiment and the AUD/USD price.
Elsewhere, to the absence of any hawkish surprises from the Federal Reserve (Fed) and other central major bankers during last week’s Jackson Hole Symposium. It’s worth noting that Fed Chair Jerome Powell showed readiness for rate hikes while pushing back rate cut bias during his key Jackson Hole speech.
Talking about the data, Australia’s seasonally adjusted Retail Sales for July rose to 0.5% MoM versus 0.3% expected and -0.8% prior. On the other hand, the US Dallas Fed Manufacturing Business Index improved to -17.2 for August versus -21.6 expected and -20.0 prior.
While portraying the mood, Wall Street benchmarks closed in the green for the second consecutive day while the US 10-year Treasury bond yields dropped three basis points (bps) to 4.20% and the two-year counterpart declined half a percent to 5.5% at the latest.
Looking forward, a speech from the future RBA Governor Bullock will be crucial for the AUD/USD buyers as the Aussie central bank has paused the rate hikes in the last two consecutive meetings. Her will became more important as Australian Treasurer Jim Chalmers flagged expectations of witnessing substantially weaker Australian growth due to higher interest rates from the Reserve Bank of Australia (RBA) and China’s slowdown.
Following that, the US Conference Board’s (CB) Consumer Confidence Index for August, expected at 116.2 versus prior 117.00, will entertain the AUD/USD traders. Above all, major attention will be given to the Fed’s preferred inflation gauge, namely the US Core Personal Consumption Expenditure (PCE) Price Index for July and Nonfarm Payrolls (NFP) for August.
Bullish MACD signals and nearly oversold RSI tease the AUD/USD bulls within a 13-day-old triangle formation, currently between 0.6450 and 0.6385. However, a downward-sloping resistance line from the mid-July, near 0.6510, acts as an extra hurdle for the buyers.
Technical Levels: Supports and Resistances
AUDUSD currently trading at 0.6428 at the time of writing. Pair opened at 0.6404 and is trading with a change of 0.37% % .
| Overview | Overview.1 | |
|---|---|---|
| 0 | Today last price | 0.6428 |
| 1 | Today Daily Change | 0.0024 |
| 2 | Today Daily Change % | 0.37% |
| 3 | Today daily open | 0.6404 |
The pair remains strongly bearish on the daily time frame. It trades below the 20 SMA @ 0.6498, 50 SMA 0.6637, 100 SMA @ 0.6655 and 200 SMA @ 0.6727.
| Trends | Trends.1 | |
|---|---|---|
| 0 | Daily SMA20 | 0.6498 |
| 1 | Daily SMA50 | 0.6637 |
| 2 | Daily SMA100 | 0.6655 |
| 3 | Daily SMA200 | 0.6727 |
The previous day high was 0.6442 while the previous day low was 0.638. The daily 38.2% Fib levels comes at 0.6403, expected to provide support. Similarly, the daily 61.8% fib level is at 0.6418, expected to provide support.
Note the levels of interest below:
- Pivot support is noted at 0.6376, 0.6347, 0.6314
- Pivot resistance is noted at 0.6437, 0.647, 0.6499
| Levels | Levels.1 |
|---|---|
| Previous Daily High | 0.6442 |
| Previous Daily Low | 0.6380 |
| Previous Weekly High | 0.6488 |
| Previous Weekly Low | 0.6380 |
| Previous Monthly High | 0.6895 |
| Previous Monthly Low | 0.6599 |
| Daily Fibonacci 38.2% | 0.6403 |
| Daily Fibonacci 61.8% | 0.6418 |
| Daily Pivot Point S1 | 0.6376 |
| Daily Pivot Point S2 | 0.6347 |
| Daily Pivot Point S3 | 0.6314 |
| Daily Pivot Point R1 | 0.6437 |
| Daily Pivot Point R2 | 0.6470 |
| Daily Pivot Point R3 | 0.6499 |
[/s2If]
Download Nehcap EAWe have two EAs that are operational on our LIVE accounts.
- EA-FIX: Check out the details here. Download EA-FIX . EA-FIX is a non-grid HFT scalper.
- EA-GROWTH: High quality low dd EA using trend grids. Download EA_GROWTHJoin Our Telegram Group
")


