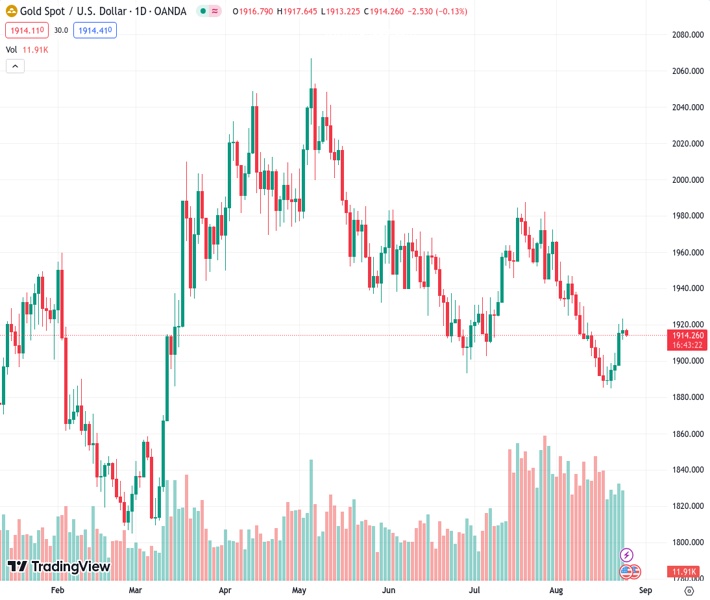
The price of gold, represented as #XAUUSD, reaches 1,914.15 and encounters a bit of a surplus in supply. As a result, it ends a four-day period of consecutive gains and comes down from its highest point in two weeks.
…
This is a premium post.
[s2If !current_user_can(access_s2member_level4)]Please register for FREE REGISTER to read full post below containing analysis. In case of any error or you think you are not able to read the full post below, please email us at support#nehcap.com [lwa][/s2If] [s2If current_user_can(access_s2member_level1)]
- Gold price meets with some supply and snaps a four-day winning streak to a two-week high.
The pair currently trades last at 1914.15.
The previous day high was 1923.43 while the previous day low was 1911.83. The daily 38.2% Fib levels comes at 1919.0, expected to provide resistance. Similarly, the daily 61.8% fib level is at 1916.26, expected to provide resistance.
Gold price extends the previous day’s late pullback from the $1,923-$1,924 region, or a two-week high and drifts lower through the Asian session on Friday. The XAU/USD currently trades just below the $1,915 level, down over 0.15% for the day, as traders now look to Federal Reserve (Fed) Chair Jerome Powell’s highly-anticipated speech at the Jackson Hole Symposium.
Investors will look for fresh cues about the Fed’s rate-hike path, which, in turn, will play a key role in influencing the near-term US Dollar (USD) price dynamics and help determine the next leg of a directional move for the Gold price. The disappointing release of the flash PMI prints from the United States (USD) on Wednesday showed that business activity in the world’s largest economy approached the stagnation point in August and pushed back expectations for further tightening by the Fed. That said, the overnight hawkish remarks by Fed officials keep the door open for one more 25 basis points (bps) lift-off by the end of this year.
Boston Fed President Susan Collins said that the Fed may be at a place to hold rates steady, though noted that more rate hikes are possible and that it is premature to signal the timing of rate cuts. Separately, Philadelphia Fed President Patrick Harker stated that the central bank must keep its restrictive stance and added that inflation needs to fall further to pave the way for any rate cuts. The hawkish outlook, meanwhile, remains supportive of elevated US Treasury bond yields and pushes the USD Index (DXY) to its highest level since June 6, which, in turn, is seen driving some flows away from the US Dollar-denominated Gold price.
That said, worries about a deeper global economic downturn might offer some support to the safe-haven precious metal and help limit the downside, at least for the time being. Against the backdrop of the worsening economic conditions in China, a host of manufacturing surveys on Wednesday painted a grim picture of the health of economies across the globe and fueled recession fears. This continues to weigh on investors’ sentiment, which is evident from a generally weaker tone around the equity markets and acts as a tailwind for the Gold price, warranting some caution before positioning for any further intraday decline.
Furthermore, the XAU/USD, so far, has managed to hold its neck above a technically significant 200-day Simple Moving Average (SMA) support. Hence, strong follow-through selling is needed to confirm that this week’s goodish rebound from sub-$1,885 levels, or the lowest since March 13 has run its course. Nevertheless, the Gold price, for now, seems to have snapped a four-day winning streak, though remains on track to register first weekly gains in the previous five.
Technical Levels: Supports and Resistances
XAUUSD currently trading at 1913.8 at the time of writing. Pair opened at 1916.92 and is trading with a change of -0.16 % .
| Overview | Overview.1 | |
|---|---|---|
| 0 | Today last price | 1913.80 |
| 1 | Today Daily Change | -3.12 |
| 2 | Today Daily Change % | -0.16 |
| 3 | Today daily open | 1916.92 |
The pair is trading below its 20 Daily moving average @ 1919.36, below its 50 Daily moving average @ 1931.59 , below its 100 Daily moving average @ 1958.96 and above its 200 Daily moving average @ 1909.38
| Trends | Trends.1 | |
|---|---|---|
| 0 | Daily SMA20 | 1919.36 |
| 1 | Daily SMA50 | 1931.59 |
| 2 | Daily SMA100 | 1958.96 |
| 3 | Daily SMA200 | 1909.38 |
The previous day high was 1923.43 while the previous day low was 1911.83. The daily 38.2% Fib levels comes at 1919.0, expected to provide resistance. Similarly, the daily 61.8% fib level is at 1916.26, expected to provide resistance.
Note the levels of interest below:
- Pivot support is noted at 1911.36, 1905.79, 1899.76
- Pivot resistance is noted at 1922.96, 1928.99, 1934.56
| Levels | Levels.1 |
|---|---|
| Previous Daily High | 1923.43 |
| Previous Daily Low | 1911.83 |
| Previous Weekly High | 1916.29 |
| Previous Weekly Low | 1885.13 |
| Previous Monthly High | 1987.54 |
| Previous Monthly Low | 1902.77 |
| Daily Fibonacci 38.2% | 1919.00 |
| Daily Fibonacci 61.8% | 1916.26 |
| Daily Pivot Point S1 | 1911.36 |
| Daily Pivot Point S2 | 1905.79 |
| Daily Pivot Point S3 | 1899.76 |
| Daily Pivot Point R1 | 1922.96 |
| Daily Pivot Point R2 | 1928.99 |
| Daily Pivot Point R3 | 1934.56 |
[/s2If]
Download Nehcap EAWe have two EAs that are operational on our LIVE accounts.
- EA-FIX: Check out the details here. Download EA-FIX . EA-FIX is a non-grid HFT scalper.
- EA-GROWTH: High quality low dd EA using trend grids. Download EA_GROWTHJoin Our Telegram Group
")


