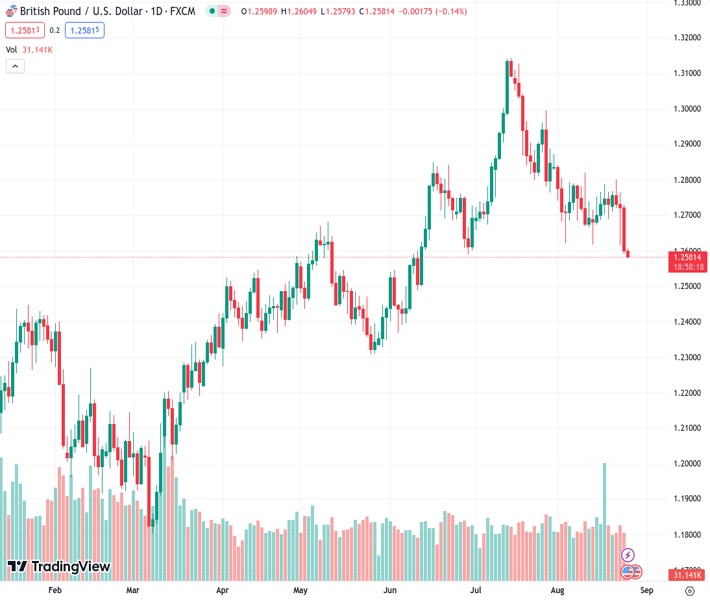
The GBP/USD currency pair, currently at a rate of 1.25833, has been steadily declining for the past four days and has now reached its lowest level in over two months.
…
This is a premium post.
[s2If !current_user_can(access_s2member_level4)]Please register for FREE REGISTER to read full post below containing analysis. In case of any error or you think you are not able to read the full post below, please email us at support#nehcap.com [lwa][/s2If] [s2If current_user_can(access_s2member_level1)]
- GBP/USD drifts lower for the fourth straight day and drops to a more than two-month low.
The pair currently trades last at 1.25833.
The previous day high was 1.2729 while the previous day low was 1.2592. The daily 38.2% Fib levels comes at 1.2644, expected to provide resistance. Similarly, the daily 61.8% fib level is at 1.2676, expected to provide resistance.
The GBP/USD pair prolongs its rejection slide from the 1.2800 mark touched earlier this week and remains under some selling pressure for the fourth successive day on Friday. Spot prices drop to a more than two-month low, around the 1.2585 region during the Asian session, confirming the overnight breakdown through a technically significant 100-day Simple Moving Average (SMA) for the first time since March 2023.
The British Pound (GBP) is undermined by rising bets for a lower Bank of England (BoE) peak rate, which, along with a bullish US Dollar (USD), continues to exert some downward pressure on the GBP/USD pair. The disappointing UK PMI prints released on Wednesday revived fears about an impending recession and convinced market participants that the BoE will not need to raise rates as high as previously thought to bring inflation back down to the target. In fact, money markets are now pricing in a small chance of any further rate hike after the anticipated 25 bps lift-off in September.
The USD, on the other hand, climbs to its highest level since June 7 and remains well supported by the overnight hawkish remarks by Federal Reserve (Fed) policymakers. In fact, Boston Fed President Susan Collins said that the central bank may be at a place to hold rates steady, though noted that more rate hikes are possible and that it is still premature to signal the timing of rate cuts. Adding to this, Philadelphia Fed President Patrick Harker stated that the central bank must keep its restrictive stance and added that inflation needs to fall further to pave the way for any rate cuts.
This, in turn, leaves the door open for one more 25 bps rate hike by the end of this year, which keeps the US Treasury bond yields elevated and continues to underpin the USD. Apart from this, some technical selling below the 100-day SMA contributes to the offered tone surrounding the GBP/USD pair and supports prospects for a further near-term depreciating move. Traders, however, might refrain from placing aggressive bets ahead of Fed Chair Jerome Powell’s speech at the Jackson Hole Symposium, due later this Friday, and BoE Governor Andrew Bailey’s statement on Saturday.
Technical Levels: Supports and Resistances
GBPUSD currently trading at 1.2589 at the time of writing. Pair opened at 1.2601 and is trading with a change of -0.1 % .
| Overview | Overview.1 | |
|---|---|---|
| 0 | Today last price | 1.2589 |
| 1 | Today Daily Change | -0.0012 |
| 2 | Today Daily Change % | -0.1000 |
| 3 | Today daily open | 1.2601 |
The pair is trading below its 20 Daily moving average @ 1.2734, below its 50 Daily moving average @ 1.2793 , below its 100 Daily moving average @ 1.2638 and above its 200 Daily moving average @ 1.2396
| Trends | Trends.1 | |
|---|---|---|
| 0 | Daily SMA20 | 1.2734 |
| 1 | Daily SMA50 | 1.2793 |
| 2 | Daily SMA100 | 1.2638 |
| 3 | Daily SMA200 | 1.2396 |
The previous day high was 1.2729 while the previous day low was 1.2592. The daily 38.2% Fib levels comes at 1.2644, expected to provide resistance. Similarly, the daily 61.8% fib level is at 1.2676, expected to provide resistance.
Note the levels of interest below:
- Pivot support is noted at 1.2552, 1.2503, 1.2415
- Pivot resistance is noted at 1.2689, 1.2778, 1.2827
| Levels | Levels.1 |
|---|---|
| Previous Daily High | 1.2729 |
| Previous Daily Low | 1.2592 |
| Previous Weekly High | 1.2788 |
| Previous Weekly Low | 1.2617 |
| Previous Monthly High | 1.3142 |
| Previous Monthly Low | 1.2659 |
| Daily Fibonacci 38.2% | 1.2644 |
| Daily Fibonacci 61.8% | 1.2676 |
| Daily Pivot Point S1 | 1.2552 |
| Daily Pivot Point S2 | 1.2503 |
| Daily Pivot Point S3 | 1.2415 |
| Daily Pivot Point R1 | 1.2689 |
| Daily Pivot Point R2 | 1.2778 |
| Daily Pivot Point R3 | 1.2827 |
[/s2If]
Download Nehcap EAWe have two EAs that are operational on our LIVE accounts.
- EA-FIX: Check out the details here. Download EA-FIX . EA-FIX is a non-grid HFT scalper.
- EA-GROWTH: High quality low dd EA using trend grids. Download EA_GROWTHJoin Our Telegram Group
")


