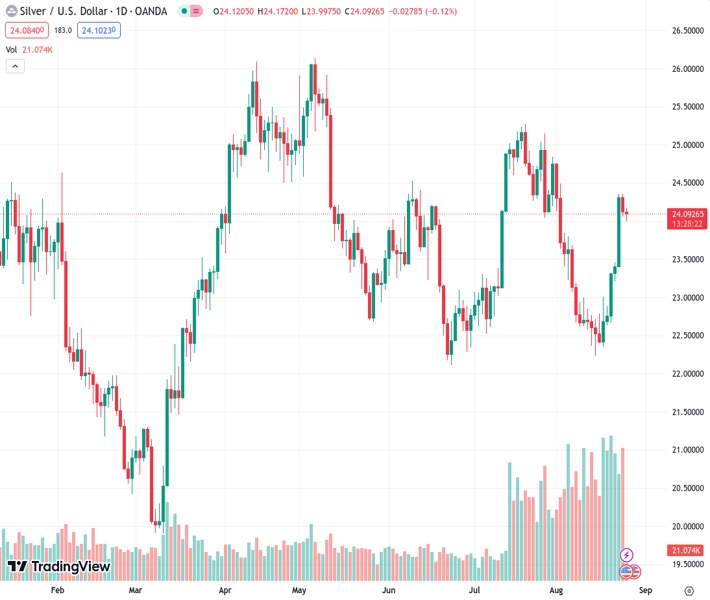
Silver, denoted by #XAGUSD and currently valued at 24.083, retreats from a high point reached earlier this week, but lacks continuation in its downward movement.
…
This is a premium post.
[s2If !current_user_can(access_s2member_level4)]Please register for FREE REGISTER to read full post below containing analysis. In case of any error or you think you are not able to read the full post below, please email us at support#nehcap.com [lwa][/s2If] [s2If current_user_can(access_s2member_level1)]
- Silver moves away from a multi-week high set on Wednesday, albeit lacks follow-through.
The pair currently trades last at 24.083.
The previous day high was 24.35 while the previous day low was 24.06. The daily 38.2% Fib levels comes at 24.17, expected to provide resistance. Similarly, the daily 61.8% fib level is at 24.24, expected to provide resistance.
Silver remains under some selling pressure for the second successive day on Friday and retreats further from a three-week top, around the $24.35 region touched on Wednesday. The white metal remains depressed through the early part of the European session and currently trades around the $24.00 round-figure mark, down just over 0.10% for the day.
The XAG/USD, however, manages to hold above the $23.85-$23.80 confluence, comprising the 23.6% Fibonacci retracement level of the recent rally from the monthly low and the 200-period Simple Moving Average (SMA) on the 4-hour chart. The said area could act as a pivotal point for intraday traders and help limit any further decline, against the backdrop of positive technical indicators on 4-hour/daily charts.
A sustained break below, however, might prompt some technical selling and drag the XAG/USD towards the 38.2% Fibo. level, around the $23.55 region. This is closely followed by another confluence support near the $23.40 area, comprising the 200-day SMA and the 50% Fibo. level, which if broken decisively might shift the near-term bias in favour of bearish traders and pave the way for some meaningful downside.
Zooming out to the daily chart, the recent price action witnessed since early June seems to constitute the formation of a bearish head and shoulders pattern on the daily chart. The pattern, however, will be confirmed on a sustained break below the neckline support, around the $22.20-$22.10 region.
In the meantime, bulls need to wait for some follow-through buying beyond the overnight swing high, around the $24.35 area, before placing fresh bets. The XAG/USD might then aim to surpass the $24.55-$24.60 intermediate hurdle and aim to reclaim the $25.00 psychological mark before climbing to the $25.25 zone, or the July monthly swing high. Some follow-through buying should pave the way for a rise to the $26.00 mark.
Technical Levels: Supports and Resistances
XAGUSD currently trading at 24.09 at the time of writing. Pair opened at 24.12 and is trading with a change of -0.12 % .
| Overview | Overview.1 | |
|---|---|---|
| 0 | Today last price | 24.09 |
| 1 | Today Daily Change | -0.03 |
| 2 | Today Daily Change % | -0.12 |
| 3 | Today daily open | 24.12 |
The pair remains strongly bullish on the daily timeframe. It trades above its 20 SMA @ 23.32, 50 SMA 23.53, 100 SMA @ 23.99 and 200 SMA @ 23.33.
| Trends | Trends.1 | |
|---|---|---|
| 0 | Daily SMA20 | 23.32 |
| 1 | Daily SMA50 | 23.53 |
| 2 | Daily SMA100 | 23.99 |
| 3 | Daily SMA200 | 23.33 |
The previous day high was 24.35 while the previous day low was 24.06. The daily 38.2% Fib levels comes at 24.17, expected to provide resistance. Similarly, the daily 61.8% fib level is at 24.24, expected to provide resistance.
Note the levels of interest below:
- Pivot support is noted at 24.0, 23.88, 23.7
- Pivot resistance is noted at 24.3, 24.47, 24.59
| Levels | Levels.1 |
|---|---|
| Previous Daily High | 24.35 |
| Previous Daily Low | 24.06 |
| Previous Weekly High | 23.01 |
| Previous Weekly Low | 22.23 |
| Previous Monthly High | 25.27 |
| Previous Monthly Low | 22.52 |
| Daily Fibonacci 38.2% | 24.17 |
| Daily Fibonacci 61.8% | 24.24 |
| Daily Pivot Point S1 | 24.00 |
| Daily Pivot Point S2 | 23.88 |
| Daily Pivot Point S3 | 23.70 |
| Daily Pivot Point R1 | 24.30 |
| Daily Pivot Point R2 | 24.47 |
| Daily Pivot Point R3 | 24.59 |
[/s2If]
Download Nehcap EAWe have two EAs that are operational on our LIVE accounts.
- EA-FIX: Check out the details here. Download EA-FIX . EA-FIX is a non-grid HFT scalper.
- EA-GROWTH: High quality low dd EA using trend grids. Download EA_GROWTHJoin Our Telegram Group
")


