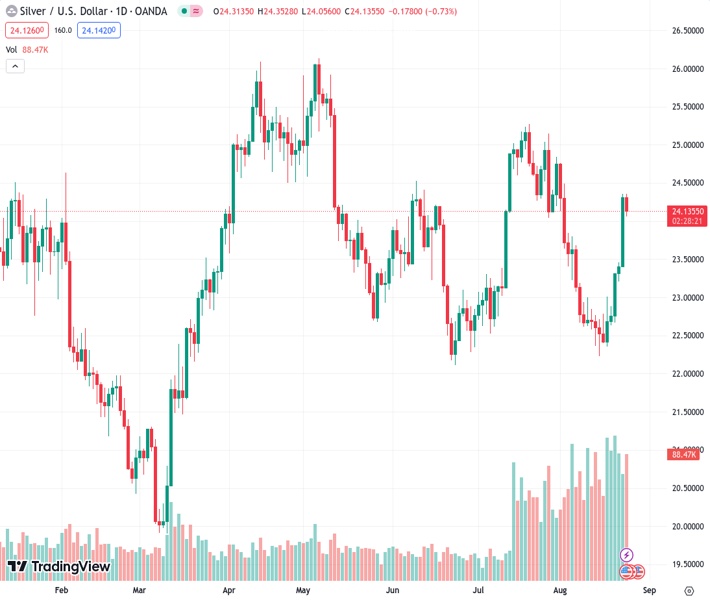
The XAGUSD pair, which had a strong surge of over 3% on Wednesday, dropped slightly to $24.15.
…
This is a premium post.
[s2If !current_user_can(access_s2member_level4)]Please register for FREE REGISTER to read full post below containing analysis. In case of any error or you think you are not able to read the full post below, please email us at support#nehcap.com [lwa][/s2If] [s2If current_user_can(access_s2member_level1)]
- XAG/USD slightly retreated to $24.15 after rallying more than 3% on Wednesday.
The pair currently trades last at 24.126.
The previous day high was 24.36 while the previous day low was 23.41. The daily 38.2% Fib levels comes at 24.0, expected to provide support. Similarly, the daily 61.8% fib level is at 23.77, expected to provide support.
The Silver spot price XAU/USD traded with losses on Thursday, mainly driven by a stronger USD and investors taking profits after Wednesday’s rally. The US reported strong labour market data while the annual Jackson Hole Symposium kicked off at Kansas City, where Jerome Powell will deliver a speech on Friday.
The latest Jobless Claims data from the US from the second week of August underscores the labour market’s resilience. The number of people filling for unemployment benefits reached 230,000, lower than the consensus estimate and the prior count of 240,000. Concurrently, the Durable Goods report for July revealed a significant softening, droping by 5%, higher than the expctations of a 4.2% decline.
Reacting to the data, the USD trades strongly on rising US yields, often seen as the cost of holding non-yielding metals. The 2-year yield rose to 5%, while the 5- and 10-year rates advanced towards 4.40% and 4.22%. In addition, a stronger USD and limits the XAG/USD advanced as the DXY index jumped to the 103.80 area.
Markets focus now shifts to Jerome Powell’s speech on Friday. As the Federal Reserve (Fed) stated, decisions will remain data-dependent so investors will pay close attention in the Fed’s Chairman stance. As for now, manufacturing and services PMIs from the US showed weakness while inflation decelerated, and the labour market still shows strength. Regarding expectations, markets still bet low odds of 35% of a 25 basis point (bps) in the November meeting, according to the CME FedWatch tool.
As per the daily chart analysis, the XAG/USD has a bullish technical bias for the short term. The Relative Strength Index (RSI) also exhibits a negative slope above its midline while Moving Average Convergence Divergence (MACD) displays green bars. Furthermore, the pair is above the 20,100,200-day Simple Moving Averages (SMAs9, indicating a favourable position for the bulls in the bigger picture.
Support levels: $24.00 (20-day SMA), $23.70, $23.50
Resistance levels: $24.30, $24.50, $24.80
Technical Levels: Supports and Resistances
XAGUSD currently trading at 24.15 at the time of writing. Pair opened at 24.32 and is trading with a change of -0.7 % .
| Overview | Overview.1 | |
|---|---|---|
| 0 | Today last price | 24.15 |
| 1 | Today Daily Change | -0.17 |
| 2 | Today Daily Change % | -0.70 |
| 3 | Today daily open | 24.32 |
The pair remains strongly bullish on the daily timeframe. It trades above its 20 SMA @ 23.32, 50 SMA 23.52, 100 SMA @ 23.99 and 200 SMA @ 23.32.
| Trends | Trends.1 | |
|---|---|---|
| 0 | Daily SMA20 | 23.32 |
| 1 | Daily SMA50 | 23.52 |
| 2 | Daily SMA100 | 23.99 |
| 3 | Daily SMA200 | 23.32 |
The previous day high was 24.36 while the previous day low was 23.41. The daily 38.2% Fib levels comes at 24.0, expected to provide support. Similarly, the daily 61.8% fib level is at 23.77, expected to provide support.
Note the levels of interest below:
- Pivot support is noted at 23.7, 23.08, 22.75
- Pivot resistance is noted at 24.65, 24.98, 25.6
| Levels | Levels.1 |
|---|---|
| Previous Daily High | 24.36 |
| Previous Daily Low | 23.41 |
| Previous Weekly High | 23.01 |
| Previous Weekly Low | 22.23 |
| Previous Monthly High | 25.27 |
| Previous Monthly Low | 22.52 |
| Daily Fibonacci 38.2% | 24.00 |
| Daily Fibonacci 61.8% | 23.77 |
| Daily Pivot Point S1 | 23.70 |
| Daily Pivot Point S2 | 23.08 |
| Daily Pivot Point S3 | 22.75 |
| Daily Pivot Point R1 | 24.65 |
| Daily Pivot Point R2 | 24.98 |
| Daily Pivot Point R3 | 25.60 |
[/s2If]
Download Nehcap EAWe have two EAs that are operational on our LIVE accounts.
- EA-FIX: Check out the details here. Download EA-FIX . EA-FIX is a non-grid HFT scalper.
- EA-GROWTH: High quality low dd EA using trend grids. Download EA_GROWTHJoin Our Telegram Group
")


