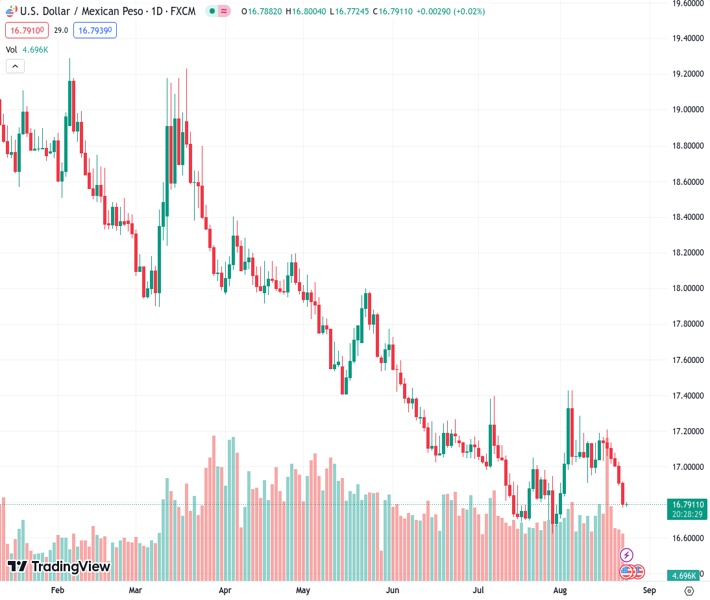
The USDMXN exchange rate of 16.7911 experiences significant fluctuations to reach its lowest point in three weeks, following a continuous decline over the past six days. However, analysts predict that the downside potential is expected to be limited.
…
This is a premium post.
[s2If !current_user_can(access_s2member_level4)]Please register for FREE REGISTER to read full post below containing analysis. In case of any error or you think you are not able to read the full post below, please email us at support#nehcap.com [lwa][/s2If] [s2If current_user_can(access_s2member_level1)]
- USD/MXN seesaws at the lowest level in three weeks after declining in the last six consecutive days.
The pair currently trades last at 16.7911.
The previous day high was 16.9235 while the previous day low was 16.781. The daily 38.2% Fib levels comes at 16.8354, expected to provide resistance. Similarly, the daily 61.8% fib level is at 16.869, expected to provide resistance.
USD/MXN seesaws around 16.80 as bears take a breather at a three-week low during early Thursday, after declining for six consecutive days. In doing so, the Mexican Peso (MXN) pair portrays the market’s cautious mood as a two-day-long annual Jackson Hole Symposium event begins.
It’s worth noting that the clear downside break of the 200-SMA and 61.8% Fibonacci Retracement of July 28 to August 04 upside, respectively near 16.95 and 16.93, joins the bearish MACD signals to lure the Mexican Peso buyers.
However, oversold conditions of the RSI (14) line suggest the brighter chances of the USD/MXN pair’s bottom-picking amid the pre-event anxiety.
As a result, a horizontal area comprising multiple levels marked since July 17, around 16.70 by the press time, gains major attention.
If at all the USD/MXN bears keep the reins past 16.70, the multi-year low marked in July at around 16.62 will put a floor under the price.
On the flip side, the aforementioned key Fibonacci retracement level around 16.93, also known as the “Golden Ratio”, precedes the 200-SMA level of 16.95 to restrict the short-term recovery of the USD/MXN pair.
Following that, a downward-sloping resistance line from August 04, close to 17.05 at the latest, will act as the final defense of the Mexican Peso pair sellers.
Trend: Limited downside expected
Technical Levels: Supports and Resistances
USDMXN currently trading at 16.7889 at the time of writing. Pair opened at 16.7917 and is trading with a change of -0.02% % .
| Overview | Overview.1 | |
|---|---|---|
| 0 | Today last price | 16.7889 |
| 1 | Today Daily Change | -0.0028 |
| 2 | Today Daily Change % | -0.02% |
| 3 | Today daily open | 16.7917 |
The pair remains strongly bearish on the daily time frame. It trades below the 20 SMA @ 17.0111, 50 SMA 17.0105, 100 SMA @ 17.3926 and 200 SMA @ 18.154.
| Trends | Trends.1 | |
|---|---|---|
| 0 | Daily SMA20 | 17.0111 |
| 1 | Daily SMA50 | 17.0105 |
| 2 | Daily SMA100 | 17.3926 |
| 3 | Daily SMA200 | 18.1540 |
The previous day high was 16.9235 while the previous day low was 16.781. The daily 38.2% Fib levels comes at 16.8354, expected to provide resistance. Similarly, the daily 61.8% fib level is at 16.869, expected to provide resistance.
Note the levels of interest below:
- Pivot support is noted at 16.7406, 16.6895, 16.5981
- Pivot resistance is noted at 16.8831, 16.9746, 17.0256
| Levels | Levels.1 |
|---|---|
| Previous Daily High | 16.9235 |
| Previous Daily Low | 16.7810 |
| Previous Weekly High | 17.2094 |
| Previous Weekly Low | 16.9663 |
| Previous Monthly High | 17.3957 |
| Previous Monthly Low | 16.6258 |
| Daily Fibonacci 38.2% | 16.8354 |
| Daily Fibonacci 61.8% | 16.8690 |
| Daily Pivot Point S1 | 16.7406 |
| Daily Pivot Point S2 | 16.6895 |
| Daily Pivot Point S3 | 16.5981 |
| Daily Pivot Point R1 | 16.8831 |
| Daily Pivot Point R2 | 16.9746 |
| Daily Pivot Point R3 | 17.0256 |
[/s2If]
Download Nehcap EAWe have two EAs that are operational on our LIVE accounts.
- EA-FIX: Check out the details here. Download EA-FIX . EA-FIX is a non-grid HFT scalper.
- EA-GROWTH: High quality low dd EA using trend grids. Download EA_GROWTHJoin Our Telegram Group
")


