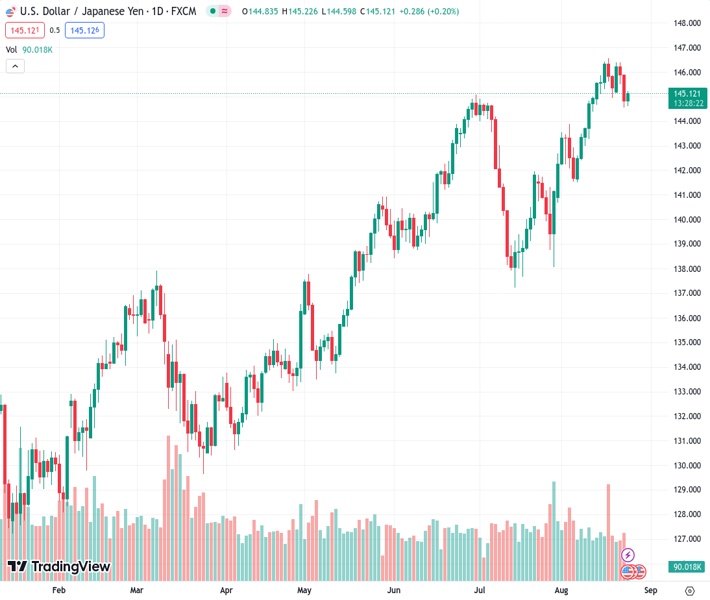
The USDJPY pair is displaying a significant increase in value at 145.127 because of the favorable sentiment regarding Asian stock markets.
…
This is a premium post.
[s2If !current_user_can(access_s2member_level4)]Please register for FREE REGISTER to read full post below containing analysis. In case of any error or you think you are not able to read the full post below, please email us at support#nehcap.com [lwa][/s2If] [s2If current_user_can(access_s2member_level1)]
- USD/JPY is experiencing strength due to the positive tone around the Asian equity markets.
The pair currently trades last at 145.127.
The previous day high was 145.89 while the previous day low was 144.54. The daily 38.2% Fib levels comes at 145.06, expected to provide support. Similarly, the daily 61.8% fib level is at 145.38, expected to provide resistance.
USD/JPY trades higher around 145.10 at the time of writing during the Asian session on Thursday, recovering losses from the previous day. The pair is cheering up the positive sentiment around the Asian equity markets. However, the Greenback faced downward pressure due to the downbeat US PMI data released on Wednesday.
The pair could face resistance around the nine-day Exponential Moving Average (EMA) at 145.22, following the 146.00 psychological level. A firm break above that level could support the USD/JPY pair to explore the area around the weekly high at 146.40.
On the downside, the 23.6% Fibonacci retracement at 144.36 appears to be the immediate support, followed by the 21-day EMA at 14.24. A breakout below that level could open the doors for the pair to navigate the area around 38.2% Fibo at 143.00.
The 14-day Relative Strength Index (RSI) remains above 50, which suggests a bullish bias of the USD/JPY traders. In the short term, the outlook remains bullish as long as the Moving Average Convergence Divergence (MACD) line stays above the centerline and the signal line.
Technical Levels: Supports and Resistances
USDJPY currently trading at 145.15 at the time of writing. Pair opened at 144.84 and is trading with a change of 0.21 % .
| Overview | Overview.1 | |
|---|---|---|
| 0 | Today last price | 145.15 |
| 1 | Today Daily Change | 0.31 |
| 2 | Today Daily Change % | 0.21 |
| 3 | Today daily open | 144.84 |
The pair remains strongly bullish on the daily timeframe. It trades above its 20 SMA @ 143.95, 50 SMA 142.66, 100 SMA @ 139.6 and 200 SMA @ 136.62.
| Trends | Trends.1 | |
|---|---|---|
| 0 | Daily SMA20 | 143.95 |
| 1 | Daily SMA50 | 142.66 |
| 2 | Daily SMA100 | 139.60 |
| 3 | Daily SMA200 | 136.62 |
The previous day high was 145.89 while the previous day low was 144.54. The daily 38.2% Fib levels comes at 145.06, expected to provide support. Similarly, the daily 61.8% fib level is at 145.38, expected to provide resistance.
Note the levels of interest below:
- Pivot support is noted at 144.29, 143.74, 142.94
- Pivot resistance is noted at 145.64, 146.44, 146.99
| Levels | Levels.1 |
|---|---|
| Previous Daily High | 145.89 |
| Previous Daily Low | 144.54 |
| Previous Weekly High | 146.56 |
| Previous Weekly Low | 144.65 |
| Previous Monthly High | 144.91 |
| Previous Monthly Low | 137.24 |
| Daily Fibonacci 38.2% | 145.06 |
| Daily Fibonacci 61.8% | 145.38 |
| Daily Pivot Point S1 | 144.29 |
| Daily Pivot Point S2 | 143.74 |
| Daily Pivot Point S3 | 142.94 |
| Daily Pivot Point R1 | 145.64 |
| Daily Pivot Point R2 | 146.44 |
| Daily Pivot Point R3 | 146.99 |
[/s2If]
Download Nehcap EAWe have two EAs that are operational on our LIVE accounts.
- EA-FIX: Check out the details here. Download EA-FIX . EA-FIX is a non-grid HFT scalper.
- EA-GROWTH: High quality low dd EA using trend grids. Download EA_GROWTHJoin Our Telegram Group
")


