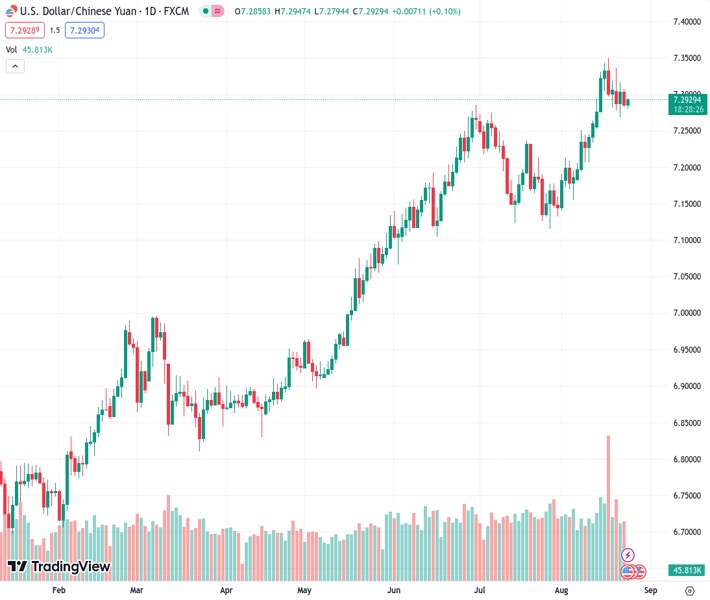
The USDCNH currency pair, trading at a rate of 7.29391, has started to gain interest from buyers, disregarding the recent breach of a support line that had been in place for a month. However, the overall expectation is that any potential gains in the pair will be limited.
…
This is a premium post.
[s2If !current_user_can(access_s2member_level4)]Please register for FREE REGISTER to read full post below containing analysis. In case of any error or you think you are not able to read the full post below, please email us at support#nehcap.com [lwa][/s2If] [s2If current_user_can(access_s2member_level1)]
- USD/CNH picks up bids to defy downside break of one-month-old support line.
The pair currently trades last at 7.29391.
The previous day high was 7.309 while the previous day low was 7.2828. The daily 38.2% Fib levels comes at 7.2928, expected to provide support. Similarly, the daily 61.8% fib level is at 7.299, expected to provide resistance.
USD/CNH reverses the previous day’s losses while refreshing the intraday high around 7.2915 amid early Thursday. In doing so, the offshore Chinese Yuan (CNH) pair prods the support-turned-resistance line from late July amid market’s consolidation ahead of the top-tier US data and Jackson Hold speeches.
It’s worth noting that the previous day’s downbeat PMIs for August renewed policy pivot concerns about them major central banks and highlight August 24-26 speeches at the Jackson Hole Symposium.
Also read: S&P500 Futures edge higher, yields stabilize after stellar moves, focus on central bankers
Apart from the cautious mood, the previous support line surrounding 7.2920 and the bearish MACD signals also challenge the USD/CNH buyers.
Following that, a convergence of the 21-DMA and one-week-long falling trend line, close to the 7.3000 round figure will be a tough nut to crack for the bulls before challenging the monthly high of near 7.3500.
On the flip side, the USD/CNH sellers may wait for a clear downside below the previous day’s bottom of around 7.2810 to initial the intraday short positions.
Even so, the 100-SMA and early August highs, respectively near 7.2595 and 7.2510, will challenge the Yuan pair sellers before giving them control.
Trend: Limited upside expected
Technical Levels: Supports and Resistances
USDCNH currently trading at 7.293 at the time of writing. Pair opened at 7.2872 and is trading with a change of 0.08% % .
| Overview | Overview.1 | |
|---|---|---|
| 0 | Today last price | 7.293 |
| 1 | Today Daily Change | 0.0058 |
| 2 | Today Daily Change % | 0.08% |
| 3 | Today daily open | 7.2872 |
The pair remains strongly bullish on the daily timeframe. It trades above its 20 SMA @ 7.2416, 50 SMA 7.217, 100 SMA @ 7.1054 and 200 SMA @ 7.007.
| Trends | Trends.1 | |
|---|---|---|
| 0 | Daily SMA20 | 7.2416 |
| 1 | Daily SMA50 | 7.2170 |
| 2 | Daily SMA100 | 7.1054 |
| 3 | Daily SMA200 | 7.0070 |
The previous day high was 7.309 while the previous day low was 7.2828. The daily 38.2% Fib levels comes at 7.2928, expected to provide support. Similarly, the daily 61.8% fib level is at 7.299, expected to provide resistance.
Note the levels of interest below:
- Pivot support is noted at 7.2769, 7.2667, 7.2506
- Pivot resistance is noted at 7.3032, 7.3193, 7.3295
| Levels | Levels.1 |
|---|---|
| Previous Daily High | 7.3090 |
| Previous Daily Low | 7.2828 |
| Previous Weekly High | 7.3496 |
| Previous Weekly Low | 7.2580 |
| Previous Monthly High | 7.2744 |
| Previous Monthly Low | 7.1160 |
| Daily Fibonacci 38.2% | 7.2928 |
| Daily Fibonacci 61.8% | 7.2990 |
| Daily Pivot Point S1 | 7.2769 |
| Daily Pivot Point S2 | 7.2667 |
| Daily Pivot Point S3 | 7.2506 |
| Daily Pivot Point R1 | 7.3032 |
| Daily Pivot Point R2 | 7.3193 |
| Daily Pivot Point R3 | 7.3295 |
[/s2If]
Download Nehcap EAWe have two EAs that are operational on our LIVE accounts.
- EA-FIX: Check out the details here. Download EA-FIX . EA-FIX is a non-grid HFT scalper.
- EA-GROWTH: High quality low dd EA using trend grids. Download EA_GROWTHJoin Our Telegram Group
")


