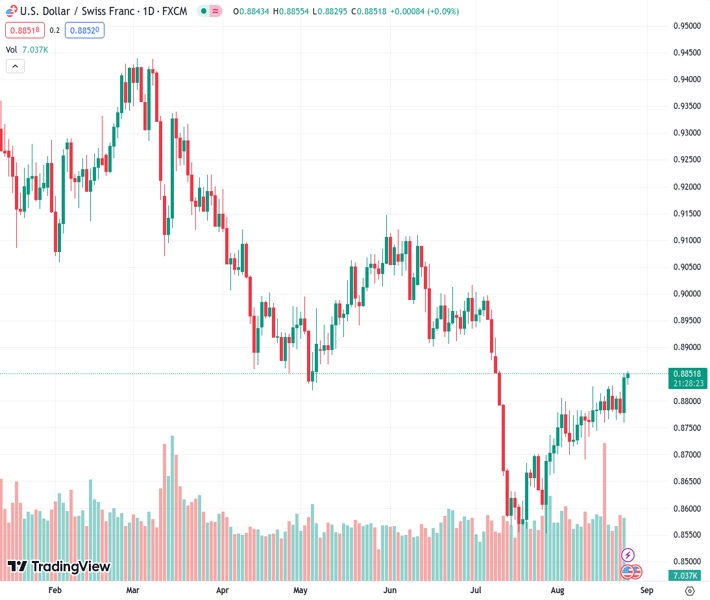
The USD/CHF pair, currently trading at 0.88440, is showing a consistent upward trend and is nearing its highest daily closing level in approximately one month, which is approximately around 0.8853.
…
This is a premium post.
[s2If !current_user_can(access_s2member_level4)]Please register for FREE REGISTER to read full post below containing analysis. In case of any error or you think you are not able to read the full post below, please email us at support#nehcap.com [lwa][/s2If] [s2If current_user_can(access_s2member_level1)]
- USD/CHF continues to rise, approaching the highest daily close in a month at around 0.8853.
The pair currently trades last at 0.88440.
The previous day high was 0.8817 while the previous day low was 0.8774. The daily 38.2% Fib levels comes at 0.8791, expected to provide support. Similarly, the daily 61.8% fib level is at 0.8801, expected to provide support.
The USD/CHF pair extends its upside to the highest daily close in a month above the 0.8850 mark during the Asian trading hours on Friday. The pair currently trades near 0.8853, gaining 0.09% on the day. Meanwhile, the US Dollar Index (DXY), a measure of the value of USD against six other major currencies, surges to the 104.00 mark, supported by the higher US Treasury yields. That said, the 10-year US Treasury yield climbs to 4.24%, while the 2-year yield remains stay above 5%.
On Thursday, US Durable Goods Orders MoM declined -5.2% in July, above expectations of -4% but falling short of the previous month’s gain of 4.4%. This is the greatest drop since April 2020. Meanwhile, the Chicago Fed National Activity Index increased to 0.12 in July from -0.33 prior, and the Kansas Fed Manufacturing Activity Index rose to 12.0 in August from -20.0 in the previous month.
Philadelphia Federal Reserve (Fed) President Patrick Harker stated at the Jackson Hole Symposium that the central bank has probably done enough with restrictive monetary policy. He also said that he believes the Fed will remain interest rate stable this year, but that next year would depend on the data. While, Boston Fed President Susan Collins said further rate rises are possible and that sending a strong signal regarding the timing of rate cuts is premature.
On the other hand, the Swiss Federal Customs Administration reported earlier this week that Switzerland’s Trade Balance narrowed to 3,129M against the market consensus of 4,300M. Meanwhile, Exports were down 16.7% in July. In the same period, Imports dropped by 12.5%. Nevertheless, growing concerns about China’s deteriorating economic conditions should dampen market optimism. This may benefit the traditional safe-haven Swiss Franc and act as a headwind for the USD/CHF pair.
In the absence of economic data released from Switzerland, the USD/CHF pair continues to be at the mercy of USD price dynamics. Market participants will keep an eye on Fed Chairman Jerome Powell’s Speech on Friday. The events will be critical for determining a clear movement for the pair.
Technical Levels: Supports and Resistances
USDCHF currently trading at 0.8853 at the time of writing. Pair opened at 0.8781 and is trading with a change of 0.82 % .
| Overview | Overview.1 | |
|---|---|---|
| 0 | Today last price | 0.8853 |
| 1 | Today Daily Change | 0.0072 |
| 2 | Today Daily Change % | 0.8200 |
| 3 | Today daily open | 0.8781 |
The pair is trading above its 20 Daily moving average @ 0.8762, above its 50 Daily moving average @ 0.8801 , below its 100 Daily moving average @ 0.8894 and below its 200 Daily moving average @ 0.909
| Trends | Trends.1 | |
|---|---|---|
| 0 | Daily SMA20 | 0.8762 |
| 1 | Daily SMA50 | 0.8801 |
| 2 | Daily SMA100 | 0.8894 |
| 3 | Daily SMA200 | 0.9090 |
The previous day high was 0.8817 while the previous day low was 0.8774. The daily 38.2% Fib levels comes at 0.8791, expected to provide support. Similarly, the daily 61.8% fib level is at 0.8801, expected to provide support.
Note the levels of interest below:
- Pivot support is noted at 0.8764, 0.8747, 0.8721
- Pivot resistance is noted at 0.8807, 0.8834, 0.8851
| Levels | Levels.1 |
|---|---|
| Previous Daily High | 0.8817 |
| Previous Daily Low | 0.8774 |
| Previous Weekly High | 0.8828 |
| Previous Weekly Low | 0.8738 |
| Previous Monthly High | 0.9005 |
| Previous Monthly Low | 0.8552 |
| Daily Fibonacci 38.2% | 0.8791 |
| Daily Fibonacci 61.8% | 0.8801 |
| Daily Pivot Point S1 | 0.8764 |
| Daily Pivot Point S2 | 0.8747 |
| Daily Pivot Point S3 | 0.8721 |
| Daily Pivot Point R1 | 0.8807 |
| Daily Pivot Point R2 | 0.8834 |
| Daily Pivot Point R3 | 0.8851 |
[/s2If]
Download Nehcap EAWe have two EAs that are operational on our LIVE accounts.
- EA-FIX: Check out the details here. Download EA-FIX . EA-FIX is a non-grid HFT scalper.
- EA-GROWTH: High quality low dd EA using trend grids. Download EA_GROWTHJoin Our Telegram Group
")


