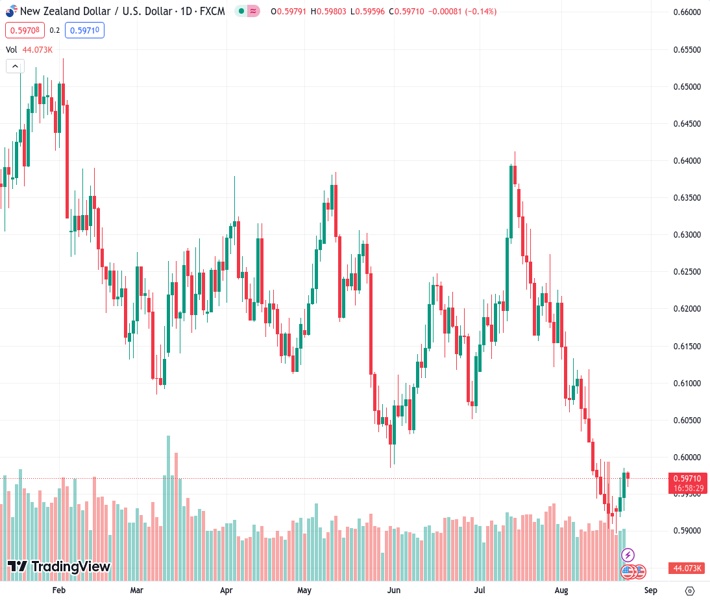
The NZDUSD currency pair, trading at a level of 0.59715, is finding it difficult to take full advantage of its rebound from the lowest point reached so far this year.
…
This is a premium post.
[s2If !current_user_can(access_s2member_level4)]Please register for FREE REGISTER to read full post below containing analysis. In case of any error or you think you are not able to read the full post below, please email us at support#nehcap.com [lwa][/s2If] [s2If current_user_can(access_s2member_level1)]
- NZD/USD struggles to capitalize on its recovery from the YTD low touched this week.
The pair currently trades last at 0.59715.
The previous day high was 0.5987 while the previous day low was 0.5927. The daily 38.2% Fib levels comes at 0.5964, expected to provide support. Similarly, the daily 61.8% fib level is at 0.595, expected to provide support.
The NZD/USD pair edges lower during the Asian session on Thursday and erodes a part of the previous day’s strong move up to a one-week high. The pair currently trades around the 0.5970 region, down nearly 0.15% for the day, and is weighed down by a modest US Dollar (USD) uptick.
In fact, the USD Index (DXY), which tracks the Greenback against a basket of currencies, stalls the overnight sharp pullback from a more than two-month high, though lacks bullish conviction. The flash US PMI prints released on Wednesday showed that business activity in the world’s largest economy approached the stagnation point in August and raised questions if the Fed can afford to increase interest rates further. This, in turn, might keep a lid on the USD and lend some support to the NZD/USD pair.
From a technical perspective, the recent recovery from sub-0.5900 levels, or a fresh low since November 2022 touched last week, fails near a resistance marked by the top boundary of over a one-month-old descending channel. The said barrier, currently around the 0.5985 region, is closely followed by the 0.6000 psychological mark, or the 100-period Simple Moving Average (SMA) on the 4-hour chart, which should act as a pivotal point and help determine the near-term trajectory for the NZD/USD pair.
Meanwhile, oscillators of the daily chart are still holding deep in the negative territory and make it prudent to wait for a sustained breakout through the said hurdles before positioning for any further gains. Spot prices might then climb to the next relevant hurdle near the 0.6065 zone en route to the 0.6100 mark. Some follow-through buying beyond the 0.6115-0.6120 supply zone should pave the way for an extension of the NZD/USD pair’s upward trajectory witnessed over the past week or so.
On the flip side, the 0.5930 region is more likely to protect the immediate downside ahead of the 0.5900 round-figure mark. Some follow-through selling has the potential to drag the NZD/USD pair toward the trend-channel support, currently pegged near the 0.5830-0.5825 region. A convincing break below the latter will be seen as a fresh trigger for bearish traders and set the stage for deeper losses.
Technical Levels: Supports and Resistances
NZDUSD currently trading at 0.5971 at the time of writing. Pair opened at 0.598 and is trading with a change of -0.15 % .
| Overview | Overview.1 | |
|---|---|---|
| 0 | Today last price | 0.5971 |
| 1 | Today Daily Change | -0.0009 |
| 2 | Today Daily Change % | -0.1500 |
| 3 | Today daily open | 0.5980 |
The pair remains strongly bearish on the daily time frame. It trades below the 20 SMA @ 0.6037, 50 SMA 0.6138, 100 SMA @ 0.6159 and 200 SMA @ 0.6229.
| Trends | Trends.1 | |
|---|---|---|
| 0 | Daily SMA20 | 0.6037 |
| 1 | Daily SMA50 | 0.6138 |
| 2 | Daily SMA100 | 0.6159 |
| 3 | Daily SMA200 | 0.6229 |
The previous day high was 0.5987 while the previous day low was 0.5927. The daily 38.2% Fib levels comes at 0.5964, expected to provide support. Similarly, the daily 61.8% fib level is at 0.595, expected to provide support.
Note the levels of interest below:
- Pivot support is noted at 0.5942, 0.5905, 0.5883
- Pivot resistance is noted at 0.6002, 0.6024, 0.6062
| Levels | Levels.1 |
|---|---|
| Previous Daily High | 0.5987 |
| Previous Daily Low | 0.5927 |
| Previous Weekly High | 0.5997 |
| Previous Weekly Low | 0.5903 |
| Previous Monthly High | 0.6413 |
| Previous Monthly Low | 0.6120 |
| Daily Fibonacci 38.2% | 0.5964 |
| Daily Fibonacci 61.8% | 0.5950 |
| Daily Pivot Point S1 | 0.5942 |
| Daily Pivot Point S2 | 0.5905 |
| Daily Pivot Point S3 | 0.5883 |
| Daily Pivot Point R1 | 0.6002 |
| Daily Pivot Point R2 | 0.6024 |
| Daily Pivot Point R3 | 0.6062 |
[/s2If]
Download Nehcap EAWe have two EAs that are operational on our LIVE accounts.
- EA-FIX: Check out the details here. Download EA-FIX . EA-FIX is a non-grid HFT scalper.
- EA-GROWTH: High quality low dd EA using trend grids. Download EA_GROWTHJoin Our Telegram Group
")


