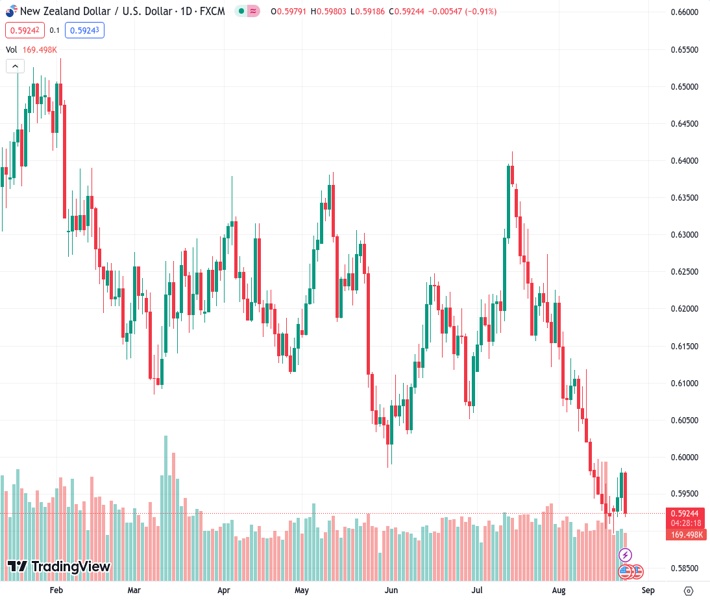
The New Zealand dollar to US dollar exchange rate dropped close to the 0.5920 level, experiencing a decrease of over 0.90%.
…
This is a premium post.
[s2If !current_user_can(access_s2member_level4)]Please register for FREE REGISTER to read full post below containing analysis. In case of any error or you think you are not able to read the full post below, please email us at support#nehcap.com [lwa][/s2If] [s2If current_user_can(access_s2member_level1)]
- The NZD/USD fell near the 0.5920 area, seeing more than 0.90% losses.
The pair currently trades last at 0.59277.
The previous day high was 0.5987 while the previous day low was 0.5927. The daily 38.2% Fib levels comes at 0.5964, expected to provide resistance. Similarly, the daily 61.8% fib level is at 0.595, expected to provide resistance.
The NZD/USD faced selling pressure on Thursday, driven by a stronger USD and higher US yields. On the Kiwi’s front, it trades as the worst performer on the session while New Zealand’s economic calendar remains empty.
On the data front, the USD reported that weekly Jobless Claims from the week ending on August 18 came in at 230,000, lower than the expected previous 240,000, pointing out that the labour market is holding firm. In addition, Durable Goods from July came in soft, dropping by 5.2%, higher than the 4% expected.
As a reaction, the 2-year yield reemerged above 5%, accompanied by the 5-year and 10-year rates making strides towards approximately 4.38% and 4.21%, while the US DXY index rose to 103.80.
Markets focus is set on Friday’s speech from Jerome Powell, where investors will look for further clues on forward guidance on the Federal Reserve’s (Fed) next moves. Meanwhile, Thomas Barking sent mixed messages on Thursday, stating that the bank has “probably already done enough” and that if inflation comes down sooner, the Fed may cut rates quicker. However, Powell’s remarks probably weigh regarding the market’s expectations on the bank’s next moves and according to the CME FedWatch tool, markets still bet on nearly 35% odds of a 25 basis point (bps) hike in the November meeting.
Observing the daily chart, the outlook tilts in favour of the bears, but they still have some work to do. The Relative Strength Index (RSI) reveals a bearish bias with a downward slope below its middle point, while the Moving Average Convergence (MACD) lays flat red bars.On the other hand, the pair is below the 20,100 and 200-day Simple Moving Averages (SMAs), indicating a challenging position for the buyers in the bigger picture, as the bears remain in command.
Support levels: 0.5900, 0.5870, 0.5850.
Resistance levels: 0.5950, 0.5980, 0.6000.
Technical Levels: Supports and Resistances
NZDUSD currently trading at 0.5924 at the time of writing. Pair opened at 0.598 and is trading with a change of -0.94 % .
| Overview | Overview.1 | |
|---|---|---|
| 0 | Today last price | 0.5924 |
| 1 | Today Daily Change | -0.0056 |
| 2 | Today Daily Change % | -0.9400 |
| 3 | Today daily open | 0.5980 |
The pair remains strongly bearish on the daily time frame. It trades below the 20 SMA @ 0.6037, 50 SMA 0.6138, 100 SMA @ 0.6159 and 200 SMA @ 0.6229.
| Trends | Trends.1 | |
|---|---|---|
| 0 | Daily SMA20 | 0.6037 |
| 1 | Daily SMA50 | 0.6138 |
| 2 | Daily SMA100 | 0.6159 |
| 3 | Daily SMA200 | 0.6229 |
The previous day high was 0.5987 while the previous day low was 0.5927. The daily 38.2% Fib levels comes at 0.5964, expected to provide resistance. Similarly, the daily 61.8% fib level is at 0.595, expected to provide resistance.
Note the levels of interest below:
- Pivot support is noted at 0.5942, 0.5905, 0.5883
- Pivot resistance is noted at 0.6002, 0.6024, 0.6062
| Levels | Levels.1 |
|---|---|
| Previous Daily High | 0.5987 |
| Previous Daily Low | 0.5927 |
| Previous Weekly High | 0.5997 |
| Previous Weekly Low | 0.5903 |
| Previous Monthly High | 0.6413 |
| Previous Monthly Low | 0.6120 |
| Daily Fibonacci 38.2% | 0.5964 |
| Daily Fibonacci 61.8% | 0.5950 |
| Daily Pivot Point S1 | 0.5942 |
| Daily Pivot Point S2 | 0.5905 |
| Daily Pivot Point S3 | 0.5883 |
| Daily Pivot Point R1 | 0.6002 |
| Daily Pivot Point R2 | 0.6024 |
| Daily Pivot Point R3 | 0.6062 |
[/s2If]
Download Nehcap EAWe have two EAs that are operational on our LIVE accounts.
- EA-FIX: Check out the details here. Download EA-FIX . EA-FIX is a non-grid HFT scalper.
- EA-GROWTH: High quality low dd EA using trend grids. Download EA_GROWTHJoin Our Telegram Group
")


