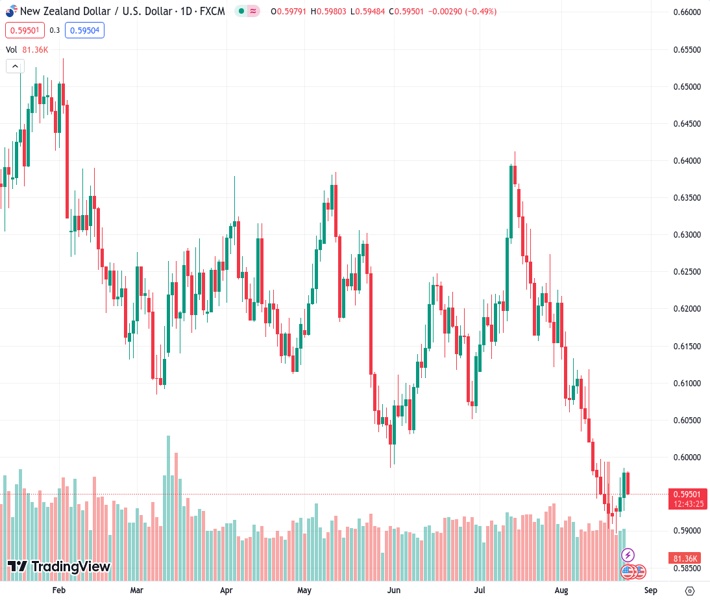
The New Zealand dollar to US dollar exchange rate, at 0.59519, faces significant selling pressure as the US dollar demand increases, causing it to decline.
…
This is a premium post.
[s2If !current_user_can(access_s2member_level4)]Please register for FREE REGISTER to read full post below containing analysis. In case of any error or you think you are not able to read the full post below, please email us at support#nehcap.com [lwa][/s2If] [s2If current_user_can(access_s2member_level1)]
- NZD/USD comes under heavy selling pressure and is weighed down by resurgent USD demand.
The pair currently trades last at 0.59519.
The previous day high was 0.5987 while the previous day low was 0.5927. The daily 38.2% Fib levels comes at 0.5964, expected to provide resistance. Similarly, the daily 61.8% fib level is at 0.595, expected to provide support.
The NZD/USD pair meets with a fresh supply on Thursday and reverses a major part of the previous day’s positive move to the 0.5985 region, or a one-week high. Spot prices touched a daily low, around mid-0.5900s during the early part of the European session and for now, seem to have stalled this week’s recovery from the lowest level since November 2022.
The US Dollar (USD) makes a solid comeback after Wednesday’s sharp pullback from a more than two-month high and turns out to be a key factor exerting pressure on the NZD/USD pair. Against the backdrop of the worsening economic conditions in China, a host of manufacturing surveys released on Wednesday painted a grim picture of the health of economies across the globe. This, in turn, fuels worries about a deeper global economic downturn and drives some haven flow towards the USD.
Meanwhile, the flash US PMI prints also showed that business activity in the world’s largest economy approached the stagnation point in August and pushed back against expectations for further policy tightening by the Federal Reserve (Fed). This drags the yield on the benchmark 10-year US Treasury note away from a 16-year high. Furthermore, the optimism over signs of easing US-China trade tensions might cap gains for the buck and lend support to antipodean currencies, including the Kiwi.
Traders might also refrain from placing aggressive directional bets and prefer to move to the sidelines ahead of the Jackson Hole Symposium, where comments by Fed Chair Jerome Powell will be scrutinized for cues about the future rate-hike path. This, in turn, will influence the USD and provide a fresh impetus to the NZD/USD pair. In the meantime, traders on Thursday will look to the US economic docket – featuring the Weekly Jobless Claims and Durable Goods Orders – for short-term opportunities.
Technical Levels: Supports and Resistances
NZDUSD currently trading at 0.5949 at the time of writing. Pair opened at 0.598 and is trading with a change of -0.52 % .
| Overview | Overview.1 | |
|---|---|---|
| 0 | Today last price | 0.5949 |
| 1 | Today Daily Change | -0.0031 |
| 2 | Today Daily Change % | -0.5200 |
| 3 | Today daily open | 0.5980 |
The pair remains strongly bearish on the daily time frame. It trades below the 20 SMA @ 0.6037, 50 SMA 0.6138, 100 SMA @ 0.6159 and 200 SMA @ 0.6229.
| Trends | Trends.1 | |
|---|---|---|
| 0 | Daily SMA20 | 0.6037 |
| 1 | Daily SMA50 | 0.6138 |
| 2 | Daily SMA100 | 0.6159 |
| 3 | Daily SMA200 | 0.6229 |
The previous day high was 0.5987 while the previous day low was 0.5927. The daily 38.2% Fib levels comes at 0.5964, expected to provide resistance. Similarly, the daily 61.8% fib level is at 0.595, expected to provide support.
Note the levels of interest below:
- Pivot support is noted at 0.5942, 0.5905, 0.5883
- Pivot resistance is noted at 0.6002, 0.6024, 0.6062
| Levels | Levels.1 |
|---|---|
| Previous Daily High | 0.5987 |
| Previous Daily Low | 0.5927 |
| Previous Weekly High | 0.5997 |
| Previous Weekly Low | 0.5903 |
| Previous Monthly High | 0.6413 |
| Previous Monthly Low | 0.6120 |
| Daily Fibonacci 38.2% | 0.5964 |
| Daily Fibonacci 61.8% | 0.5950 |
| Daily Pivot Point S1 | 0.5942 |
| Daily Pivot Point S2 | 0.5905 |
| Daily Pivot Point S3 | 0.5883 |
| Daily Pivot Point R1 | 0.6002 |
| Daily Pivot Point R2 | 0.6024 |
| Daily Pivot Point R3 | 0.6062 |
[/s2If]
Download Nehcap EAWe have two EAs that are operational on our LIVE accounts.
- EA-FIX: Check out the details here. Download EA-FIX . EA-FIX is a non-grid HFT scalper.
- EA-GROWTH: High quality low dd EA using trend grids. Download EA_GROWTHJoin Our Telegram Group
")


