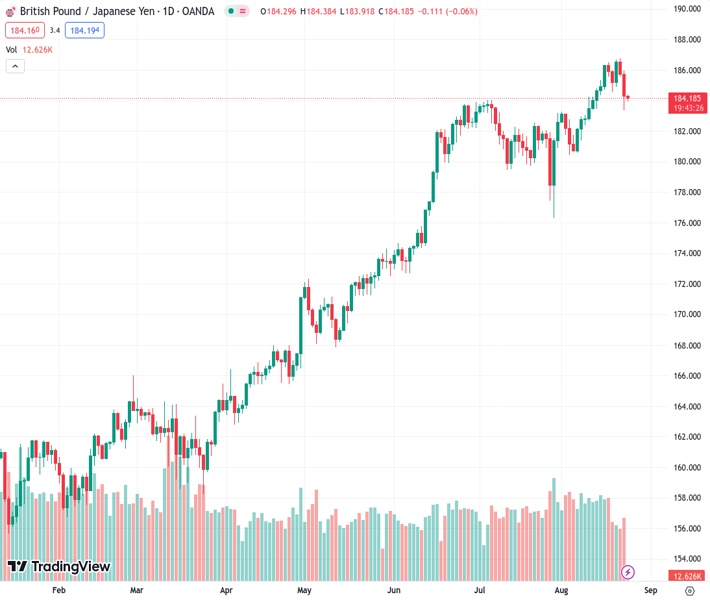
The GBPJPY pair has experienced three consecutive days of losses, remaining at a relatively low level seen in the past two weeks.
…
This is a premium post.
[s2If !current_user_can(access_s2member_level4)]Please register for FREE REGISTER to read full post below containing analysis. In case of any error or you think you are not able to read the full post below, please email us at support#nehcap.com [lwa][/s2If] [s2If current_user_can(access_s2member_level1)]
- GBP/JPY prints three-day losing streak, sticks to mild losses at two-week low of late.
The pair currently trades last at 184.184.
The previous day high was 185.95 while the previous day low was 183.38. The daily 38.2% Fib levels comes at 184.36, expected to provide resistance. Similarly, the daily 61.8% fib level is at 184.96, expected to provide resistance.
GBP/JPY sellers flirt with the 184.00 round figure during the initial hours of Tokyo open on Thursday. In doing so, the cross-currency pair justifies the market’s cautious mood ahead of the top-tier data/event while also keeping the previous day’s bearish bias amid downbeat Treasury bond yields and expectations of the Bank of Japan (BoJ) meddling.
GBP/JPY stays defensive around 184.00, close to 184.15 by the press time, as sentiment dwindles on the start of a two-day-long annual Jackson Hole Symposium.
That said, downbeat prints of the UK’s Purchasing Managers Index (PMI) for August, versus firmer Japan PMI, drowned the GBP/JPY price amid fears of British recession. Also weighing on the cross-currency pair is the slump in the US Treasury bond yields.
On Wednesday, preliminary readings of the UK S&P Global/CIPS Manufacturing PMI dropped to 42.5 for August from 45.3 versus 45.0 market forecasts whereas the Services counterpart also edged lower to 48.7, compared to 50.8 expected and 51.5 marked the previous month. With this, the S&P Global/CIPS Composite PMI for Britain eased to 47.9 for the said month from 50.8 prior and the analysts’ estimations of 50.3.
At home, Japan’s first reading of the Jibun Bank Manufacturing PMI for August improves to 49.7 from 49.6, versus 49.5 expected, whereas the Services counterpart rose to 54.3 for the said month from 53.8 previous figures.
Elsewhere, the US 10-year Treasury bond yields flashed the biggest daily fall in three weeks to portray the market’s optimism, sluggish around 4.19% by the press time.
Apart from the aforementioned catalysts, upbeat headlines surrounding the US-China trade ties also improved the mood and weighed on the GBP/JPY prices. That said, US Commerce Secretary Gina Raimondo’s visit to Beijing, scheduled for next week, flags hopes of improvement in the US-China trade ties. On the same line are the early-week news suggesting the US removal of 27 Chinese entities from its Unverified List, lifting sanctions from those entities and flagging hopes of improving diplomatic ties.
Above all, the recently easing hawkish bias about the Bank of England (BoE) versus hopes of the Bank of Japan’s (BoJ) exit from the ultra-easy monetary policy favors the GBP/JPY bears. As a result, Friday’s Tokyo Consumer Price Index (CPI) data and central bankers’ speech will be crucial to determine near-term directions.
A five-month-old rising wedge bearish chart formation, currently between 182.70 and 186.80, keeps the GBP/JPY pair sellers hopeful.
Technical Levels: Supports and Resistances
GBPJPY currently trading at 184.14 at the time of writing. Pair opened at 184.34 and is trading with a change of -0.11 % .
| Overview | Overview.1 | |
|---|---|---|
| 0 | Today last price | 184.14 |
| 1 | Today Daily Change | -0.20 |
| 2 | Today Daily Change % | -0.11 |
| 3 | Today daily open | 184.34 |
The pair remains strongly bullish on the daily timeframe. It trades above its 20 SMA @ 183.43, 50 SMA 182.53, 100 SMA @ 176.44 and 200 SMA @ 169.38.
| Trends | Trends.1 | |
|---|---|---|
| 0 | Daily SMA20 | 183.43 |
| 1 | Daily SMA50 | 182.53 |
| 2 | Daily SMA100 | 176.44 |
| 3 | Daily SMA200 | 169.38 |
The previous day high was 185.95 while the previous day low was 183.38. The daily 38.2% Fib levels comes at 184.36, expected to provide resistance. Similarly, the daily 61.8% fib level is at 184.96, expected to provide resistance.
Note the levels of interest below:
- Pivot support is noted at 183.16, 181.98, 180.59
- Pivot resistance is noted at 185.73, 187.13, 188.3
| Levels | Levels.1 |
|---|---|
| Previous Daily High | 185.95 |
| Previous Daily Low | 183.38 |
| Previous Weekly High | 186.47 |
| Previous Weekly Low | 183.46 |
| Previous Monthly High | 184.02 |
| Previous Monthly Low | 176.32 |
| Daily Fibonacci 38.2% | 184.36 |
| Daily Fibonacci 61.8% | 184.96 |
| Daily Pivot Point S1 | 183.16 |
| Daily Pivot Point S2 | 181.98 |
| Daily Pivot Point S3 | 180.59 |
| Daily Pivot Point R1 | 185.73 |
| Daily Pivot Point R2 | 187.13 |
| Daily Pivot Point R3 | 188.30 |
[/s2If]
Download Nehcap EAWe have two EAs that are operational on our LIVE accounts.
- EA-FIX: Check out the details here. Download EA-FIX . EA-FIX is a non-grid HFT scalper.
- EA-GROWTH: High quality low dd EA using trend grids. Download EA_GROWTHJoin Our Telegram Group
")


