The exchange rate between the US dollar and the Indian rupee is declining to 82.4570 as a result of negative UK PMI data.
…
This is a premium post.
[s2If !current_user_can(access_s2member_level4)]Please register for FREE REGISTER to read full post below containing analysis. In case of any error or you think you are not able to read the full post below, please email us at support#nehcap.com [lwa][/s2If] [s2If current_user_can(access_s2member_level1)]
- USD/INR trades lower due to downbeat UK PMI data.
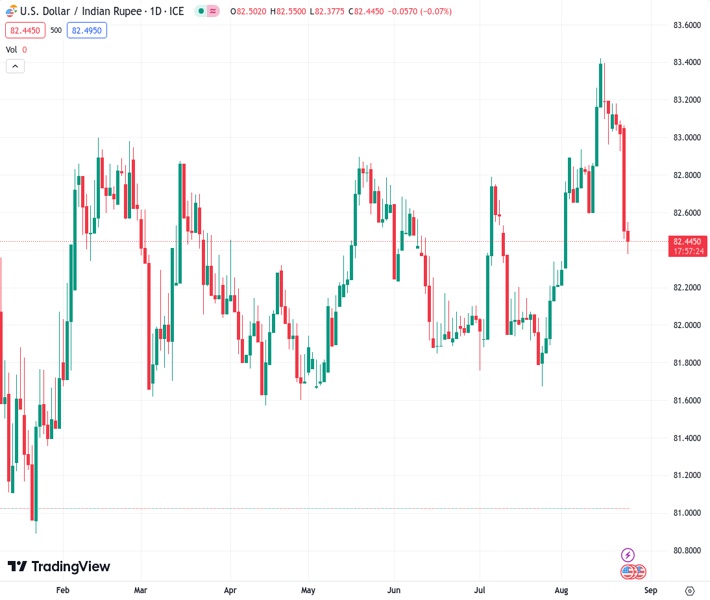
The pair currently trades last at 82.4570.
The previous day high was 83.1215 while the previous day low was 82.4546. The daily 38.2% Fib levels comes at 82.7093, expected to provide resistance. Similarly, the daily 61.8% fib level is at 82.8667, expected to provide resistance.
USD/INR trades lower around 82.50 during the Asian session on Thursday, continuing the losing streak that began on Monday. The pair has extended losses after the downbeat preliminary PMI data released from the United States (US) on Wednesday. Additionally, the US Treasury yields fell sharply on weaker US economic data, pulling back the safe-haven US Dollar (USD).
Additionally, there is ongoing market speculation concerning the potential intervention by the Reserve Bank of India (RBI) to improve the Indian currency against the Greenback. Such intervention could significantly impact the price movement of USD/INR, influencing its overall price action.
S&P Global Manufacturing PMI in August fell to 47, lower than expectations of 49.3, from the previous 49. The S&P Global Services PMI for August declined to 51 from the prior 52.3, falling short of the expected 52.2.
Weaker US PMI data has signaled weaker economic activities, flaring the likelihood of an interest rate hike in the September meeting by the US Federal Reserve (Fed). This put the market participants into cautious status, awaiting Fed Chair Jerome Powell’s speech on Friday during Jackson Hole’s annual symposium. The US Dollar Index (DXY), measures the performance of the US Dollar (USD) against the six major currencies, hovering around 103.40 at the time of writing.
The Indian Rupee (INR) traders will likely watch the upcoming release of India’s FX Reserves for the week ending on August 18, scheduled to be released on Friday. Market participants will also likely monitor Initial Jobless Claims from the United States (US) scheduled to be released later in the day. These datasets might offer fresh impetus for USD/INR traders.
Technical Levels: Supports and Resistances
USDINR currently trading at 82.4706 at the time of writing. Pair opened at 82.5455 and is trading with a change of -0.09 % .
| Overview | Overview.1 | |
|---|---|---|
| 0 | Today last price | 82.4706 |
| 1 | Today Daily Change | -0.0749 |
| 2 | Today Daily Change % | -0.0900 |
| 3 | Today daily open | 82.5455 |
The pair is trading below its 20 Daily moving average @ 82.8453, above its 50 Daily moving average @ 82.3989 , above its 100 Daily moving average @ 82.3007 and above its 200 Daily moving average @ 82.2521
| Trends | Trends.1 | |
|---|---|---|
| 0 | Daily SMA20 | 82.8453 |
| 1 | Daily SMA50 | 82.3989 |
| 2 | Daily SMA100 | 82.3007 |
| 3 | Daily SMA200 | 82.2521 |
The previous day high was 83.1215 while the previous day low was 82.4546. The daily 38.2% Fib levels comes at 82.7093, expected to provide resistance. Similarly, the daily 61.8% fib level is at 82.8667, expected to provide resistance.
Note the levels of interest below:
- Pivot support is noted at 82.2929, 82.0402, 81.6259
- Pivot resistance is noted at 82.9598, 83.3741, 83.6268
| Levels | Levels.1 |
|---|---|
| Previous Daily High | 83.1215 |
| Previous Daily Low | 82.4546 |
| Previous Weekly High | 83.5505 |
| Previous Weekly Low | 82.8946 |
| Previous Monthly High | 82.8334 |
| Previous Monthly Low | 81.6588 |
| Daily Fibonacci 38.2% | 82.7093 |
| Daily Fibonacci 61.8% | 82.8667 |
| Daily Pivot Point S1 | 82.2929 |
| Daily Pivot Point S2 | 82.0402 |
| Daily Pivot Point S3 | 81.6259 |
| Daily Pivot Point R1 | 82.9598 |
| Daily Pivot Point R2 | 83.3741 |
| Daily Pivot Point R3 | 83.6268 |
[/s2If]
Download Nehcap EAWe have two EAs that are operational on our LIVE accounts.
- EA-FIX: Check out the details here. Download EA-FIX . EA-FIX is a non-grid HFT scalper.
- EA-GROWTH: High quality low dd EA using trend grids. Download EA_GROWTHJoin Our Telegram Group
")


