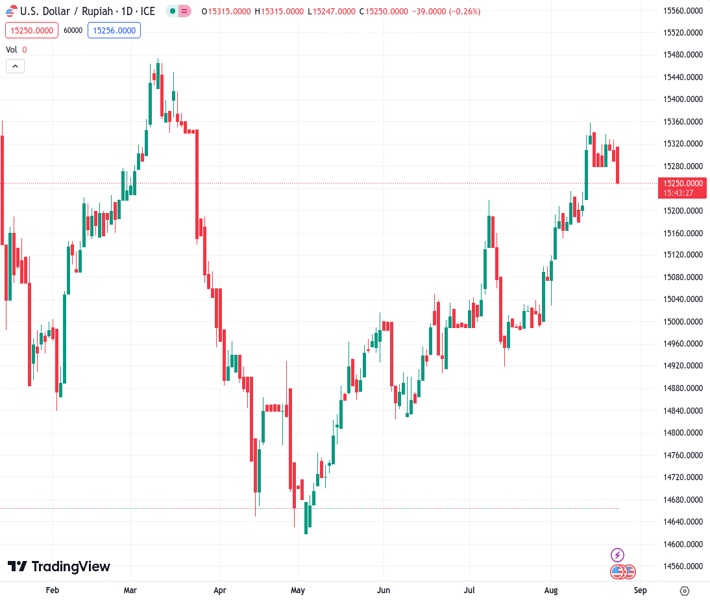
The exchange rate between the US dollar and Indonesian rupiah, currently at 15,250.0, is experiencing a decline for the third day in a row. It is now approaching the lowest point reached this week as sell orders continue to be placed.
…
This is a premium post.
[s2If !current_user_can(access_s2member_level4)]Please register for FREE REGISTER to read full post below containing analysis. In case of any error or you think you are not able to read the full post below, please email us at support#nehcap.com [lwa][/s2If] [s2If current_user_can(access_s2member_level1)]
- USD/IDR takes offers to renew weekly low, down for the third consecutive day.
The pair currently trades last at 15250.0.
The previous day high was 15329.0 while the previous day low was 15295.0. The daily 38.2% Fib levels comes at 15307.988, expected to provide resistance. Similarly, the daily 61.8% fib level is at 15316.012, expected to provide resistance.
USD/IDR prepares for the Bank Indonesia (BI) Interest Rate Decision by refreshing the weekly low near 15,250 early Thursday. In doing so, the Indonesia Rupiah (IDR) pair cheers the downbeat US Dollar and slightly positive mood in the Asia-Pacific zone to print a three-day losing streak.
The US Dollar Index (DXY) remains pressured around 103.30 after reversing from an 11-week high the previous day. That said, the Greenback’s gauge versus the six major currencies reached a multi-day high amid the market’s anxiety ahead of the top-tier data/events. However, downbeat prints of the US PMIs for August, as well as unimpressive housing data, pushed back the hawkish bias about the Federal Reserve and weighed on the DXY afterward.
Not only in the US but softer activity numbers from the major economies also tame fears of the higher rates and allow the traders to pare previous losses amid the upbeat performance of Wall Street and a slump in the US Treasury bond yields.
It’s worth noting that optimism in China, one of Indonesia’s biggest customers, also allows the USD/IDR bears to better prepare for the BI Interest Rate Decision even as no change is expected in the benchmark 5.75% rates.
Amid these plays, S&P500 Futures rose 0.70% to 4,480 by the press time, after rising the most in a month the previous day, whereas stocks in China and Hong Kong are up as well. Also, the US 10-year Treasury bond yields seesaw around 4.20%, pausing a two-day losing streak from the highest level since 2007, following the biggest daily slump in three weeks.
Looking forward, the BI decision is less likely to affect the USD/IDR price unless it offers any major surprises, which are off the table. As a result, today’s US Durable Goods Orders, Chicago Fed National Activity Index, Kansas Fed Manufacturing Activity and weekly Jobless Claims should be watched carefully for intraday directions. Above all, the two-day-long annual Jackson Hole Symposium and Friday’s Fed Chair Jerome Powell’s speech at the key event will be crucial for a clear guide.
Although the USD/IDR pair’s failure to cross the 15,400 hurdle weighs on the prices, a one-month-old rising support line joins the 21-DMA to restrict immediate downside to around 15,250.
Technical Levels: Supports and Resistances
USDIDR currently trading at 15252.65 at the time of writing. Pair opened at 15301.05 and is trading with a change of -0.32% % .
| Overview | Overview.1 | |
|---|---|---|
| 0 | Today last price | 15252.65 |
| 1 | Today Daily Change | -48.4000 |
| 2 | Today Daily Change % | -0.32% |
| 3 | Today daily open | 15301.05 |
The pair remains strongly bullish on the daily timeframe. It trades above its 20 SMA @ 15237.915, 50 SMA 15110.544, 100 SMA @ 14983.565 and 200 SMA @ 15164.9115.
| Trends | Trends.1 | |
|---|---|---|
| 0 | Daily SMA20 | 15237.9150 |
| 1 | Daily SMA50 | 15110.5440 |
| 2 | Daily SMA100 | 14983.5650 |
| 3 | Daily SMA200 | 15164.9115 |
The previous day high was 15329.0 while the previous day low was 15295.0. The daily 38.2% Fib levels comes at 15307.988, expected to provide resistance. Similarly, the daily 61.8% fib level is at 15316.012, expected to provide resistance.
Note the levels of interest below:
- Pivot support is noted at 15287.7, 15274.35, 15253.7
- Pivot resistance is noted at 15321.7, 15342.35, 15355.7
| Levels | Levels.1 |
|---|---|
| Previous Daily High | 15329.000 |
| Previous Daily Low | 15295.000 |
| Previous Weekly High | 15397.250 |
| Previous Weekly Low | 15225.005 |
| Previous Monthly High | 15916.700 |
| Previous Monthly Low | 13588.000 |
| Daily Fibonacci 38.2% | 15307.988 |
| Daily Fibonacci 61.8% | 15316.012 |
| Daily Pivot Point S1 | 15287.700 |
| Daily Pivot Point S2 | 15274.350 |
| Daily Pivot Point S3 | 15253.700 |
| Daily Pivot Point R1 | 15321.700 |
| Daily Pivot Point R2 | 15342.350 |
| Daily Pivot Point R3 | 15355.700 |
[/s2If]
Download Nehcap EAWe have two EAs that are operational on our LIVE accounts.
- EA-FIX: Check out the details here. Download EA-FIX . EA-FIX is a non-grid HFT scalper.
- EA-GROWTH: High quality low dd EA using trend grids. Download EA_GROWTHJoin Our Telegram Group
")


