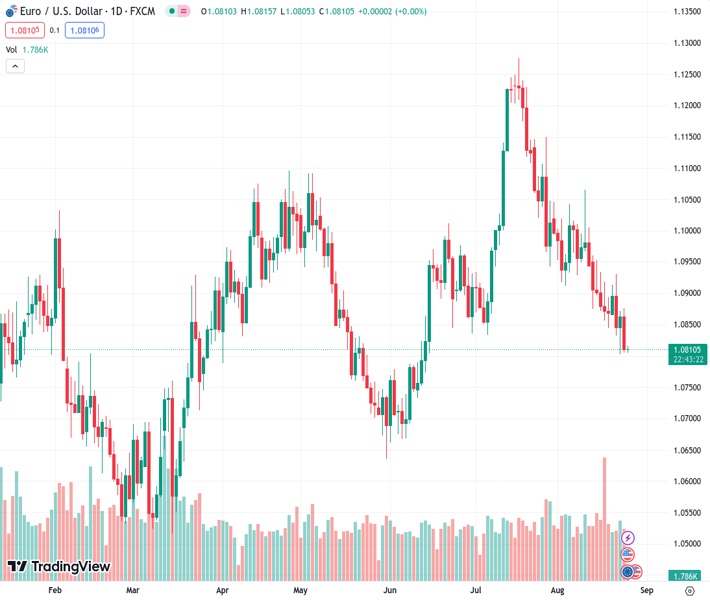
The EURUSD pair fell by over 0.50% to around 1.0810, close to the 200-day SMA.
…
This is a premium post.
[s2If !current_user_can(access_s2member_level4)]Please register for FREE REGISTER to read full post below containing analysis. In case of any error or you think you are not able to read the full post below, please email us at support#nehcap.com [lwa][/s2If] [s2If current_user_can(access_s2member_level1)]
- EUR/USD dived more than 0.50% towards the 1.0810, near the 200-day SMA.
The pair currently trades last at 1.08103.
The previous day high was 1.0872 while the previous day low was 1.0802. The daily 38.2% Fib levels comes at 1.0845, expected to provide resistance. Similarly, the daily 61.8% fib level is at 1.0829, expected to provide resistance.
On Thursday, the EUR/USD lost momentum and traded weak against the USD. Hawkish remarks made by Federal Reserve (Fed) officials gave the Greenback traction, while the European calendar had nothing relevant to offer. All eyes are now on. Jerome Powell and Christine Lagarde’s speeches on Friday and Saturday for fresh impetus.
On the US side, the USD gathered momentum following Susan Collins’ remarks indicating the potential for further rate hikes, and the market sentiment shifted, leading investors to anticipate a more aggressive approach by the Federal Reserve (Fed). This sentiment was reinforced by Thomas Barkin’s statement that the Fed would keep rates unchanged for the remainder of 2023 and consider rate cuts in 2024. As a result, US yields experienced an uptick and made the USD gain traction against its rivals.
Datawise, the US reported strong Jobless Claims from the second week of August, contributing to the rise of the US yields.
On the other hand, the European calendar had nothing relevant to offer on the data front, and the Euro recovered some ground against its rivals after trading weak on Wednesday. Investors’ focus is set on Saturday’s speech by Christine Lagarde at the Jackson Hole Symposium, where they will look for further clues regarding forward guidance. As for now, World Interest Rates Probabilities (WIRP) suggest that markets continue to discount 25 basis points in September, October and December by the European Central Bank (ECB), which would take rates to 5%.
From a technical perspective, EUR/USD retains a bearish outlook for the short term, as observed on the daily chart. The Relative Strength Index (RSI) is below its midline, in negative territory, and exhibits a southward slope. The negative signal from the Moving Average Convergence Divergence (MACD), indicated by red bars, reinforces the growing bearish momentum.
Support levels: 1.0800 (200-day SMA), 1.0750, 1.0730.
Resistance levels: 1.0860, 1.0900, 1.910-1.0930 (bearish convergence between the 20 and 100-day SMAs).
Technical Levels: Supports and Resistances
EURUSD currently trading at 1.0813 at the time of writing. Pair opened at 1.0864 and is trading with a change of -0.47 % .
| Overview | Overview.1 | |
|---|---|---|
| 0 | Today last price | 1.0813 |
| 1 | Today Daily Change | -0.0051 |
| 2 | Today Daily Change % | -0.4700 |
| 3 | Today daily open | 1.0864 |
The pair is trading below its 20 Daily moving average @ 1.0939, below its 50 Daily moving average @ 1.0982 , below its 100 Daily moving average @ 1.093 and above its 200 Daily moving average @ 1.0799
| Trends | Trends.1 | |
|---|---|---|
| 0 | Daily SMA20 | 1.0939 |
| 1 | Daily SMA50 | 1.0982 |
| 2 | Daily SMA100 | 1.0930 |
| 3 | Daily SMA200 | 1.0799 |
The previous day high was 1.0872 while the previous day low was 1.0802. The daily 38.2% Fib levels comes at 1.0845, expected to provide resistance. Similarly, the daily 61.8% fib level is at 1.0829, expected to provide resistance.
Note the levels of interest below:
- Pivot support is noted at 1.0821, 1.0777, 1.0752
- Pivot resistance is noted at 1.089, 1.0915, 1.0959
| Levels | Levels.1 |
|---|---|
| Previous Daily High | 1.0872 |
| Previous Daily Low | 1.0802 |
| Previous Weekly High | 1.0960 |
| Previous Weekly Low | 1.0845 |
| Previous Monthly High | 1.1276 |
| Previous Monthly Low | 1.0834 |
| Daily Fibonacci 38.2% | 1.0845 |
| Daily Fibonacci 61.8% | 1.0829 |
| Daily Pivot Point S1 | 1.0821 |
| Daily Pivot Point S2 | 1.0777 |
| Daily Pivot Point S3 | 1.0752 |
| Daily Pivot Point R1 | 1.0890 |
| Daily Pivot Point R2 | 1.0915 |
| Daily Pivot Point R3 | 1.0959 |
[/s2If]
Download Nehcap EAWe have two EAs that are operational on our LIVE accounts.
- EA-FIX: Check out the details here. Download EA-FIX . EA-FIX is a non-grid HFT scalper.
- EA-GROWTH: High quality low dd EA using trend grids. Download EA_GROWTHJoin Our Telegram Group
")


