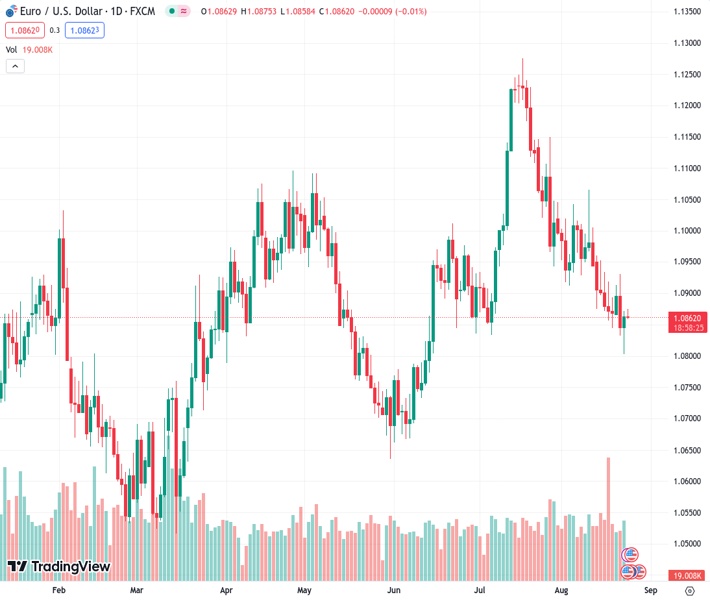
The EURUSD currency pair, currently trading at 1.08603, has started to move in the opposite direction after a period of correcting its recent decline to a 10-week low. However, it seems to be lacking strength and momentum in recent times. According to the view of @nehcap, it is anticipated that there will be a limit to the downside potential.
…
This is a premium post.
[s2If !current_user_can(access_s2member_level4)]Please register for FREE REGISTER to read full post below containing analysis. In case of any error or you think you are not able to read the full post below, please email us at support#nehcap.com [lwa][/s2If] [s2If current_user_can(access_s2member_level1)]
- EUR/USD reveres the corrective bounce off 10-week low, lacks momentum of late.
The pair currently trades last at 1.08603.
The previous day high was 1.0872 while the previous day low was 1.0802. The daily 38.2% Fib levels comes at 1.0845, expected to provide support. Similarly, the daily 61.8% fib level is at 1.0829, expected to provide support.
EUR/USD retreats from intraday high to 1.0860 as it pares the previous day’s corrective bounce off 2.5-month low early Thursday. In doing so, the major currency pair fades the previous day’s rebound from the 1.0800 support confluence comprising the 200-DMA and an ascending support line from March 15.
The Euro pair’s latest pullback could be linked to the market’s cautious mood ahead of the United States data and a start of the two-day-long annual Jackson Hole Symposium. Among the US statistics, the US Durable Goods Orders, Chicago Fed National Activity Index, Kansas Fed Manufacturing Activity and weekly Jobless Claims will gain major attention.
Also read: EUR/USD rebounds from 10-week low beneath 1.0900 on Fed, ECB policy pivot concerns, US data, yields eyed
Apart from pre-event anxiety, the bearish MACD signals also challenge the EUR/USD buyers.
However, the RSI (14) line is nearly oversold and hence suggest bottom-picking of the EUR/USD pair, which in turn highlights the 1.0800 key support including the 200-DMA and a 5.5-month-long rising trend line.
Even if the EUR/USD pair drops below 1.0800, tops marked in mid-March and early June, around 1.0780 and 1.0760 will act as additional checks for the bears.
Alternatively, the 100-DMA and a downward-sloping resistance line from early May, close to 1.0930 and 1.0940 in that order, challenge the EUR/USD buyers ahead of the 1.1000 psychological magnet.
In a case where the Euro bulls keep the reins past 1.1000, June’s peak of around 1.1015 will act as the final defense of the sellers before directing the prices toward the monthly high of around 1.1065.
Trend: Limited downside expected
Technical Levels: Supports and Resistances
EURUSD currently trading at 1.0861 at the time of writing. Pair opened at 1.0864 and is trading with a change of -0.03% % .
| Overview | Overview.1 | |
|---|---|---|
| 0 | Today last price | 1.0861 |
| 1 | Today Daily Change | -0.0003 |
| 2 | Today Daily Change % | -0.03% |
| 3 | Today daily open | 1.0864 |
The pair is trading below its 20 Daily moving average @ 1.0939, below its 50 Daily moving average @ 1.0982 , below its 100 Daily moving average @ 1.093 and above its 200 Daily moving average @ 1.0799
| Trends | Trends.1 | |
|---|---|---|
| 0 | Daily SMA20 | 1.0939 |
| 1 | Daily SMA50 | 1.0982 |
| 2 | Daily SMA100 | 1.0930 |
| 3 | Daily SMA200 | 1.0799 |
The previous day high was 1.0872 while the previous day low was 1.0802. The daily 38.2% Fib levels comes at 1.0845, expected to provide support. Similarly, the daily 61.8% fib level is at 1.0829, expected to provide support.
Note the levels of interest below:
- Pivot support is noted at 1.0821, 1.0777, 1.0752
- Pivot resistance is noted at 1.089, 1.0915, 1.0959
| Levels | Levels.1 |
|---|---|
| Previous Daily High | 1.0872 |
| Previous Daily Low | 1.0802 |
| Previous Weekly High | 1.0960 |
| Previous Weekly Low | 1.0845 |
| Previous Monthly High | 1.1276 |
| Previous Monthly Low | 1.0834 |
| Daily Fibonacci 38.2% | 1.0845 |
| Daily Fibonacci 61.8% | 1.0829 |
| Daily Pivot Point S1 | 1.0821 |
| Daily Pivot Point S2 | 1.0777 |
| Daily Pivot Point S3 | 1.0752 |
| Daily Pivot Point R1 | 1.0890 |
| Daily Pivot Point R2 | 1.0915 |
| Daily Pivot Point R3 | 1.0959 |
[/s2If]
Download Nehcap EAWe have two EAs that are operational on our LIVE accounts.
- EA-FIX: Check out the details here. Download EA-FIX . EA-FIX is a non-grid HFT scalper.
- EA-GROWTH: High quality low dd EA using trend grids. Download EA_GROWTHJoin Our Telegram Group
")


