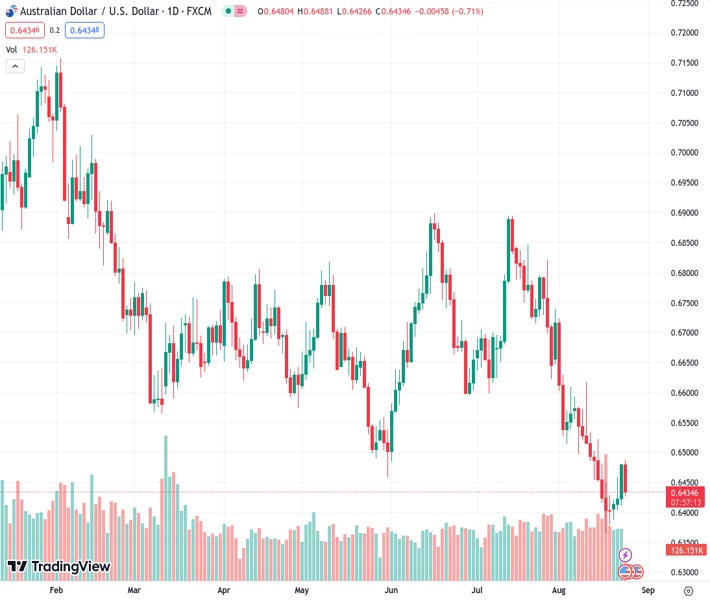
The Australian Dollar to US Dollar currency pair has experienced a significant decline to a value of 0.64314, as the US Dollar shows signs of improvement leading up to the Jackson Hole event.
…
This is a premium post.
[s2If !current_user_can(access_s2member_level4)]Please register for FREE REGISTER to read full post below containing analysis. In case of any error or you think you are not able to read the full post below, please email us at support#nehcap.com [lwa][/s2If] [s2If current_user_can(access_s2member_level1)]
- AUD/USD drops sharply as US Dollar recovers ahead of Jackson Hole.
The pair currently trades last at 0.64314.
The previous day high was 0.6482 while the previous day low was 0.6411. The daily 38.2% Fib levels comes at 0.6455, expected to provide resistance. Similarly, the daily 61.8% fib level is at 0.6438, expected to provide resistance.
The AUD/USD pair faced selling pressure after failing to recapture the psychological resistance of 0.6500 on Thursday. The Aussie asset has dropped to near 0.6450 as risk-sensitive currencies have come under pressure ahead of the Jackson Hole Symposium.
The US Dollar Index (DXY) rebounds strongly after building a base around 103.30 as investors turn cautious about Federal Reserve (Fed) chair Jerome Powell’s commentary. Investors remain mixed about whether Jerome Powell will emphasize keeping interest rates steady for a longer period or hiking interest rates further.
Meanwhile, the Australian Dollar comes under pressure as market participants expect that the Reserve Bank of Australia (RBA) will keep the interest rate policy unchanged in September. Also, rising deflation risks in China are impacting the Australian Dollar, which is a proxy to China’s economic growth.
AUD/USD has remained sideways in a 50-pip range for the past week. Broadly, the asset is forming a Bearish Flag chart pattern on an hourly scale. The consolidation part of the aforementioned chart pattern signifies inventory distribution from institutional investors to market participants. A breakdown of the same will result in the continuation of the bearish trend.
The Aussie asset fails to sustain above the 200-period Exponential Moving Average (EMA), which indicates that investors use the pullback move for a selling opportunity.
Adding to that, the Relative Strength Index (RSI) (14) slips below 40.00, which indicates that the bearish momentum has been triggered.
Going forward, a breakdown below August 22 low at 0.6403 will expose the asset to August low at 0.6364, followed by the round-level support at 0.6300.
In an alternate scenario, a recovery move above the intraday high at 0.6490 will drive the asset toward August 9 high at 0.6571. A breach of the latter will expose the asset to August 10 high at 0.6616.
Technical Levels: Supports and Resistances
AUDUSD currently trading at 0.6438 at the time of writing. Pair opened at 0.6481 and is trading with a change of -0.66 % .
| Overview | Overview.1 | |
|---|---|---|
| 0 | Today last price | 0.6438 |
| 1 | Today Daily Change | -0.0043 |
| 2 | Today Daily Change % | -0.6600 |
| 3 | Today daily open | 0.6481 |
The pair remains strongly bearish on the daily time frame. It trades below the 20 SMA @ 0.6525, 50 SMA 0.6656, 100 SMA @ 0.666 and 200 SMA @ 0.673.
| Trends | Trends.1 | |
|---|---|---|
| 0 | Daily SMA20 | 0.6525 |
| 1 | Daily SMA50 | 0.6656 |
| 2 | Daily SMA100 | 0.6660 |
| 3 | Daily SMA200 | 0.6730 |
The previous day high was 0.6482 while the previous day low was 0.6411. The daily 38.2% Fib levels comes at 0.6455, expected to provide resistance. Similarly, the daily 61.8% fib level is at 0.6438, expected to provide resistance.
Note the levels of interest below:
- Pivot support is noted at 0.6434, 0.6387, 0.6363
- Pivot resistance is noted at 0.6505, 0.6528, 0.6575
| Levels | Levels.1 |
|---|---|
| Previous Daily High | 0.6482 |
| Previous Daily Low | 0.6411 |
| Previous Weekly High | 0.6522 |
| Previous Weekly Low | 0.6364 |
| Previous Monthly High | 0.6895 |
| Previous Monthly Low | 0.6599 |
| Daily Fibonacci 38.2% | 0.6455 |
| Daily Fibonacci 61.8% | 0.6438 |
| Daily Pivot Point S1 | 0.6434 |
| Daily Pivot Point S2 | 0.6387 |
| Daily Pivot Point S3 | 0.6363 |
| Daily Pivot Point R1 | 0.6505 |
| Daily Pivot Point R2 | 0.6528 |
| Daily Pivot Point R3 | 0.6575 |
[/s2If]
Download Nehcap EAWe have two EAs that are operational on our LIVE accounts.
- EA-FIX: Check out the details here. Download EA-FIX . EA-FIX is a non-grid HFT scalper.
- EA-GROWTH: High quality low dd EA using trend grids. Download EA_GROWTHJoin Our Telegram Group
")


