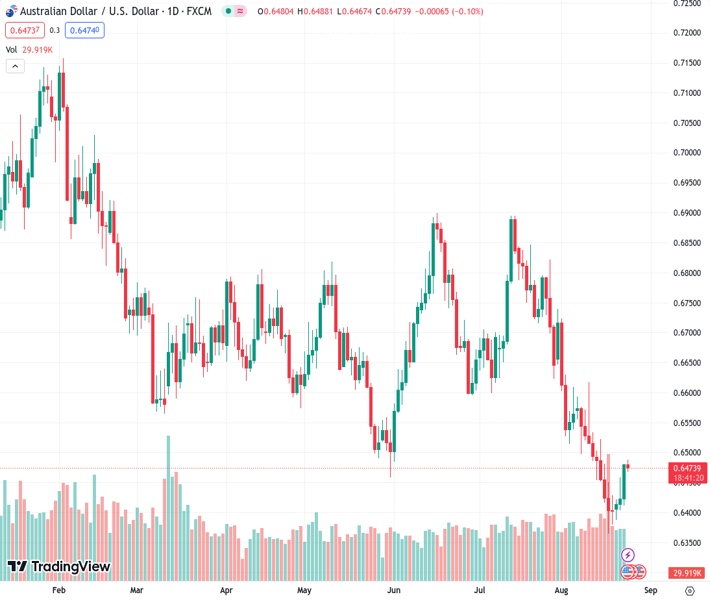
The AUDUSD pair, currently at 0.64739, is decreasing from its highest point in the past week and a half, which it reached earlier today.
…
This is a premium post.
[s2If !current_user_can(access_s2member_level4)]Please register for FREE REGISTER to read full post below containing analysis. In case of any error or you think you are not able to read the full post below, please email us at support#nehcap.com [lwa][/s2If] [s2If current_user_can(access_s2member_level1)]
- AUD/USD eases from a one-and-half-week high touched earlier this Thursday.
The pair currently trades last at 0.64739.
The previous day high was 0.6482 while the previous day low was 0.6411. The daily 38.2% Fib levels comes at 0.6455, expected to provide support. Similarly, the daily 61.8% fib level is at 0.6438, expected to provide support.
The AUD/USD pair struggles to capitalize on its weekly gains and retreats a few pips from a one-and-half-week high touched during the Asian session on Thursday. Spot prices currently trade around the 0.6475 region, down less than 0.10% for the day, as traders now look to the crucial Jackson Hole Symposium before placing fresh directional bets.
In the meantime, concerns about the worsening economic conditions in China, along with rising bets for another on-hold decision by the Reserve Bank of Australia (RBA) in September, continue to act as a headwind for the Aussie. The US Dollar (USD), on the other hand, is seen consolidating the overnight retracement slide from its highest level in more than two months and lending some support to the AUD/USD pair.
From a technical perspective, the overnight breakout through a downward-sloping channel extending from the monthly peak was seen as a fresh trigger for bulls. Moreover, oscillators on hourly charts are holding in the positive territory and support prospects for additional gains. That said, it will still be prudent to wait for a sustained strength beyond the 0.6500 psychological mark before placing fresh bullish bets.
The aforementioned handle coincides with the 100-period Simple Moving Average (SMA) on the 4-hour chart and should act as a pivotal point. Some follow-through buying should pave the way for an extension of the recent recovery from the YTD low touched last week and lift the AUD/USD pair further towards the 0.6530 region en route to the 0.6570-0.6575 horizontal barrier and the 0.6600 round-figure mark.
On the flip side, the 0.6455-0.6450 area now seems to protect the immediate downside ahead of the 0.6425-0.6420 zone and the 0.6400 mark. A convincing break below the latter will expose the YTD low, around the 0.6365 zone, below which the AUD/USD pair could eventually slide to the 0.6300 mark, representing the downside target of the bearish double-top chart pattern formation near the 0.6900 mark.
This is followed by the 0.6270 area or the November 2022 trough. Some follow-through selling might turn the AUD/USD pair vulnerable to accelerate the downfall further towards the 0.6200 round-figure mark.
Technical Levels: Supports and Resistances
AUDUSD currently trading at 0.6474 at the time of writing. Pair opened at 0.6481 and is trading with a change of -0.11 % .
| Overview | Overview.1 | |
|---|---|---|
| 0 | Today last price | 0.6474 |
| 1 | Today Daily Change | -0.0007 |
| 2 | Today Daily Change % | -0.1100 |
| 3 | Today daily open | 0.6481 |
The pair remains strongly bearish on the daily time frame. It trades below the 20 SMA @ 0.6525, 50 SMA 0.6656, 100 SMA @ 0.666 and 200 SMA @ 0.673.
| Trends | Trends.1 | |
|---|---|---|
| 0 | Daily SMA20 | 0.6525 |
| 1 | Daily SMA50 | 0.6656 |
| 2 | Daily SMA100 | 0.6660 |
| 3 | Daily SMA200 | 0.6730 |
The previous day high was 0.6482 while the previous day low was 0.6411. The daily 38.2% Fib levels comes at 0.6455, expected to provide support. Similarly, the daily 61.8% fib level is at 0.6438, expected to provide support.
Note the levels of interest below:
- Pivot support is noted at 0.6434, 0.6387, 0.6363
- Pivot resistance is noted at 0.6505, 0.6528, 0.6575
| Levels | Levels.1 |
|---|---|
| Previous Daily High | 0.6482 |
| Previous Daily Low | 0.6411 |
| Previous Weekly High | 0.6522 |
| Previous Weekly Low | 0.6364 |
| Previous Monthly High | 0.6895 |
| Previous Monthly Low | 0.6599 |
| Daily Fibonacci 38.2% | 0.6455 |
| Daily Fibonacci 61.8% | 0.6438 |
| Daily Pivot Point S1 | 0.6434 |
| Daily Pivot Point S2 | 0.6387 |
| Daily Pivot Point S3 | 0.6363 |
| Daily Pivot Point R1 | 0.6505 |
| Daily Pivot Point R2 | 0.6528 |
| Daily Pivot Point R3 | 0.6575 |
[/s2If]
Download Nehcap EAWe have two EAs that are operational on our LIVE accounts.
- EA-FIX: Check out the details here. Download EA-FIX . EA-FIX is a non-grid HFT scalper.
- EA-GROWTH: High quality low dd EA using trend grids. Download EA_GROWTHJoin Our Telegram Group
")


