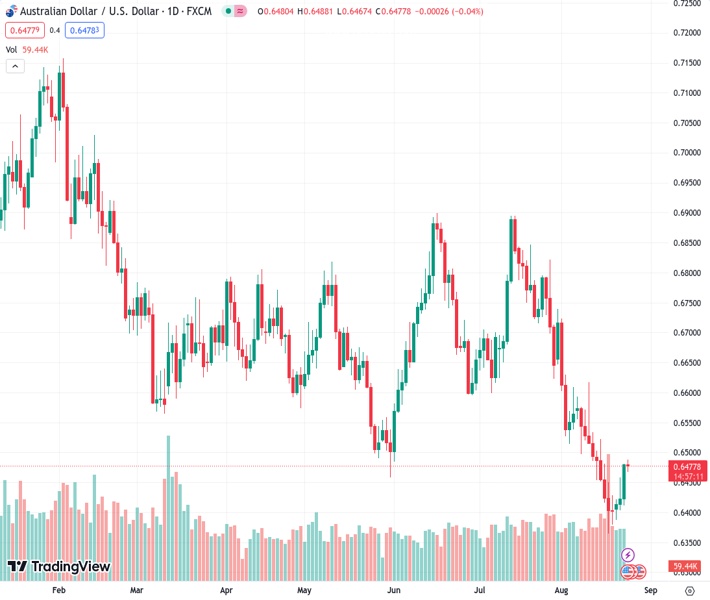
The AUDUSD currency pair, currently trading at 0.64790, is maintaining its recent increases and staying close to the 0.6480 level as it awaits the release of upcoming data from the United States.
…
This is a premium post.
[s2If !current_user_can(access_s2member_level4)]Please register for FREE REGISTER to read full post below containing analysis. In case of any error or you think you are not able to read the full post below, please email us at support#nehcap.com [lwa][/s2If] [s2If current_user_can(access_s2member_level1)]
- AUD/USD consolidates its gains near 0.6480 ahead of the US data.
The pair currently trades last at 0.64790.
The previous day high was 0.6482 while the previous day low was 0.6411. The daily 38.2% Fib levels comes at 0.6455, expected to provide support. Similarly, the daily 61.8% fib level is at 0.6438, expected to provide support.
The AUD/USD pair oscillates in a narrow trading range around 0.6480 heading into the early European session on Thursday. Market participants seem to prefer to wait on the sidelines ahead of the Federal Reserve (Fed) Chairman Jerome Powell’s Speech on Friday.
US Business activity in August expanded at a slow pace. That said, the preliminary S&P Global Composite PMI decreased to 50.4, down from 52.0 previously and below market expectations of 52.0. This is the largest decrease since November 2022. S&P Global Manufacturing PMI fell to 47 from 49 in the prior month, while Services PMI dropped to 51 from 52.4 in the previous month. Meanwhile, US annual New Home Sales came in at 714K, exceeding expectations of 705,000 by a significant margin.
In response to the data, the US Dollar weakened against its rivals, which boosted the AUD/USD pair. The US Treasury yields retreated from multi-year highs and hovered around 4.20%. The market discounted a more aggressive Federal Reserve policy for the rest of the year. According to the CME Fed Watch Tool, market pricing in 88% that the Federal Reserve (Fed) will pause the interest rate in the September meeting and would hike more rate in its November meeting. However, Market players will take cues about the interest rates outlook from the Jackson Hole Symposium on Thursday.
Across the pond, the first reading of the Australian S&P Global Composite PMI fell to 47.1 on Wednesday, from 48.2 in July. In the meantime, the Manufacturing PMI decreased to 49.4 from the 49.6 anticipated and previous, and the Service PMI decreased to 46.7 from 47.9 expected and in the previous month.
Furthermore, the People’s Bank of China (PBoC) slashed its Loan Prime Rate (LPR) for one year by a smaller margin than anticipated to 3.45% from 3.55%. This, in turn, exerts some pressure on the Aussie. Investors will keep an eye on the headlines surrounding China’s economic woes as it might impact the Aussie, a proxy for China’s economic prospects.
In the quiet day of economic data released from Australia, market players will focus on the US weekly Jobless Claims and Durable Goods Orders due on Thursday. Also, the Jackson Hole Symposium will be a closely watched event ahead of the Federal Reserve (Fed) Chairman Jerome Powell’s Speech on Friday. The events will be critical for determining a clear movement for the AUD/USD pair.
Technical Levels: Supports and Resistances
AUDUSD currently trading at 0.6481 at the time of writing. Pair opened at 0.6481 and is trading with a change of 0.0 % .
| Overview | Overview.1 | |
|---|---|---|
| 0 | Today last price | 0.6481 |
| 1 | Today Daily Change | 0.0000 |
| 2 | Today Daily Change % | 0.0000 |
| 3 | Today daily open | 0.6481 |
The pair remains strongly bearish on the daily time frame. It trades below the 20 SMA @ 0.6525, 50 SMA 0.6656, 100 SMA @ 0.666 and 200 SMA @ 0.673.
| Trends | Trends.1 | |
|---|---|---|
| 0 | Daily SMA20 | 0.6525 |
| 1 | Daily SMA50 | 0.6656 |
| 2 | Daily SMA100 | 0.6660 |
| 3 | Daily SMA200 | 0.6730 |
The previous day high was 0.6482 while the previous day low was 0.6411. The daily 38.2% Fib levels comes at 0.6455, expected to provide support. Similarly, the daily 61.8% fib level is at 0.6438, expected to provide support.
Note the levels of interest below:
- Pivot support is noted at 0.6434, 0.6387, 0.6363
- Pivot resistance is noted at 0.6505, 0.6528, 0.6575
| Levels | Levels.1 |
|---|---|
| Previous Daily High | 0.6482 |
| Previous Daily Low | 0.6411 |
| Previous Weekly High | 0.6522 |
| Previous Weekly Low | 0.6364 |
| Previous Monthly High | 0.6895 |
| Previous Monthly Low | 0.6599 |
| Daily Fibonacci 38.2% | 0.6455 |
| Daily Fibonacci 61.8% | 0.6438 |
| Daily Pivot Point S1 | 0.6434 |
| Daily Pivot Point S2 | 0.6387 |
| Daily Pivot Point S3 | 0.6363 |
| Daily Pivot Point R1 | 0.6505 |
| Daily Pivot Point R2 | 0.6528 |
| Daily Pivot Point R3 | 0.6575 |
[/s2If]
Download Nehcap EAWe have two EAs that are operational on our LIVE accounts.
- EA-FIX: Check out the details here. Download EA-FIX . EA-FIX is a non-grid HFT scalper.
- EA-GROWTH: High quality low dd EA using trend grids. Download EA_GROWTHJoin Our Telegram Group
")


