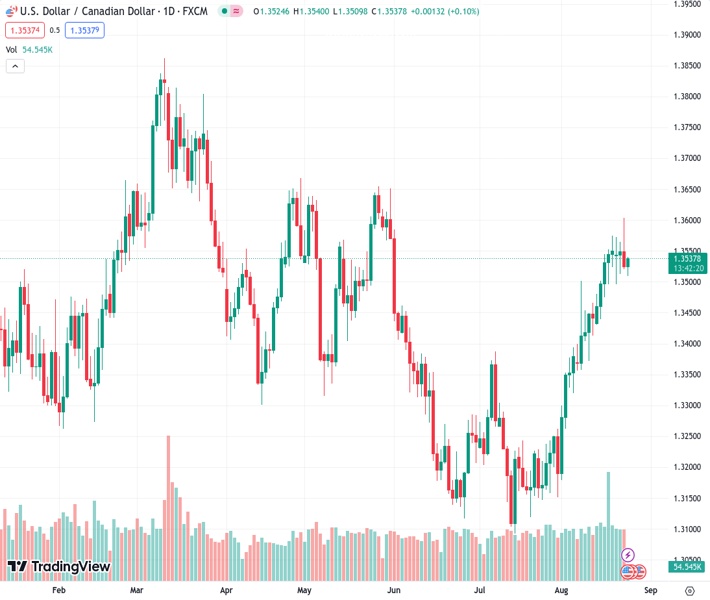
For two consecutive days, the momentum of the USDCAD currency pair has been diminishing due to the weakening of the USD.
…
This is a premium post.
[s2If !current_user_can(access_s2member_level4)]Please register for FREE REGISTER to read full post below containing analysis. In case of any error or you think you are not able to read the full post below, please email us at support#nehcap.com [lwa][/s2If] [s2If current_user_can(access_s2member_level1)]
- USD/CAD loses momentum for two days in a row amid the USD weakness.
The pair currently trades last at 1.35349.
The previous day high was 1.3604 while the previous day low was 1.352. The daily 38.2% Fib levels comes at 1.3552, expected to provide resistance. Similarly, the daily 61.8% fib level is at 1.3572, expected to provide resistance.
The USD/CAD pair trades in negative territory for the second consecutive day. The Greenback declined against its rivals due to the downbeat US PMI data and a decline in US Treasury yields. The pair currently trades near 1.3527, up 0.01% for the day.
That said, Business activity in the United States in August expanded at a slow pace. The preliminary S&P Global Composite PMI decreased to 50.4, down from 52.0 previously and below market expectations of 52.0. This is the largest decrease since November 2022. Meanwhile, US Treasury yields retreated from multi-year highs and declines below 4.20%.
From the technical perspective, USD/CAD holds below the 100-hour Exponential Moving Average (EMA), which means further downside looks favorable for the major pair. Meanwhile, the Relative Strength Index (RSI) stands below 50, activating the bearish momentum for the USD/CAD pair for the time being.
Any follow-through buying above 1.3535 will be exposed to further upside. The mentioned level is a confluence of the middle line of the Bollinger Band and the 100-hour EMA. The next upside stop is located at 1.3575 (high of August 18, the upper boundary of the Bollinger Band), followed by a psychological figure at 1.3600. Further north, the pair will see a rally to 1.3650 (a high of May 31).
On the downside, the critical support zone for USD/CAD is located at the 1.3495-1.3500 region, portraying a psychological round figure and the lower limit of the Bollinger Band. The additional downside filter to watch is 1.3475 (Low of August 16) en route to 1.3445 (Low of August 15) and finally at 1.3410 (Low of August 11).
Technical Levels: Supports and Resistances
USDCAD currently trading at 1.3527 at the time of writing. Pair opened at 1.3526 and is trading with a change of 0.01 % .
| Overview | Overview.1 | |
|---|---|---|
| 0 | Today last price | 1.3527 |
| 1 | Today Daily Change | 0.0001 |
| 2 | Today Daily Change % | 0.0100 |
| 3 | Today daily open | 1.3526 |
The pair remains strongly bullish on the daily timeframe. It trades above its 20 SMA @ 1.3417, 50 SMA 1.3294, 100 SMA @ 1.3388 and 200 SMA @ 1.3457.
| Trends | Trends.1 | |
|---|---|---|
| 0 | Daily SMA20 | 1.3417 |
| 1 | Daily SMA50 | 1.3294 |
| 2 | Daily SMA100 | 1.3388 |
| 3 | Daily SMA200 | 1.3457 |
The previous day high was 1.3604 while the previous day low was 1.352. The daily 38.2% Fib levels comes at 1.3552, expected to provide resistance. Similarly, the daily 61.8% fib level is at 1.3572, expected to provide resistance.
Note the levels of interest below:
- Pivot support is noted at 1.3496, 1.3466, 1.3412
- Pivot resistance is noted at 1.358, 1.3634, 1.3663
| Levels | Levels.1 |
|---|---|
| Previous Daily High | 1.3604 |
| Previous Daily Low | 1.3520 |
| Previous Weekly High | 1.3575 |
| Previous Weekly Low | 1.3437 |
| Previous Monthly High | 1.3387 |
| Previous Monthly Low | 1.3093 |
| Daily Fibonacci 38.2% | 1.3552 |
| Daily Fibonacci 61.8% | 1.3572 |
| Daily Pivot Point S1 | 1.3496 |
| Daily Pivot Point S2 | 1.3466 |
| Daily Pivot Point S3 | 1.3412 |
| Daily Pivot Point R1 | 1.3580 |
| Daily Pivot Point R2 | 1.3634 |
| Daily Pivot Point R3 | 1.3663 |
[/s2If]
Download Nehcap EAWe have two EAs that are operational on our LIVE accounts.
- EA-FIX: Check out the details here. Download EA-FIX . EA-FIX is a non-grid HFT scalper.
- EA-GROWTH: High quality low dd EA using trend grids. Download EA_GROWTHJoin Our Telegram Group
")


