The USDCAD pair is currently at a level of 1.3524, experiencing a decrease of 0.18%. This decline in the exchange rate is attributed to a rise in risk appetite and a decrease in US Treasury yields, which has resulted in a boost for the Canadian Dollar.
…
This is a premium post.
[s2If !current_user_can(access_s2member_level4)]Please register for FREE REGISTER to read full post below containing analysis. In case of any error or you think you are not able to read the full post below, please email us at support#nehcap.com [lwa][/s2If] [s2If current_user_can(access_s2member_level1)]
- USD/CAD down 0.18%, trading at 1.3524, as increased risk appetite and falling US Treasury yields boost the Canadian Dollar.
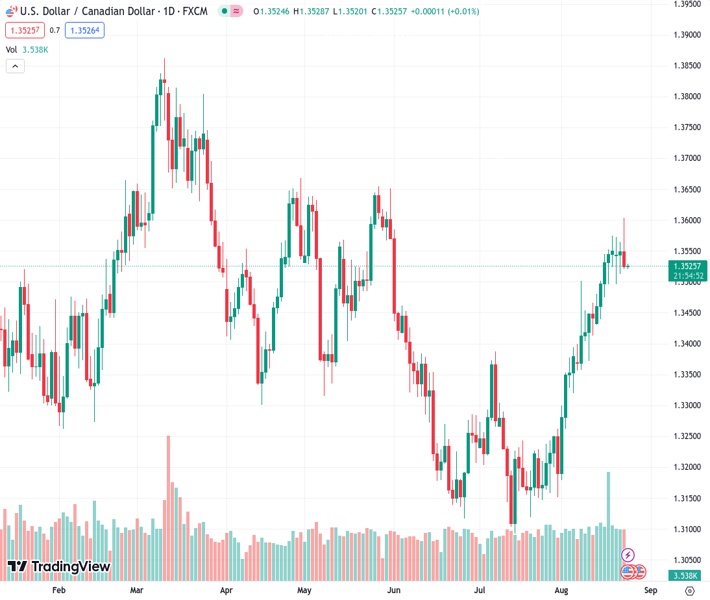
The pair currently trades last at 1.35257.
The previous day high was 1.3565 while the previous day low was 1.3513. The daily 38.2% Fib levels comes at 1.3545, expected to provide resistance. Similarly, the daily 61.8% fib level is at 1.3533, expected to provide resistance.
The Canadian Dollar (CAD) recovered some ground against the American Dollar (USD), as seen by the USD/CAD pair, finishing Wednesday’s session with losses of 0.18%. The main drivers that bolstered the CAD were increased risk appetite and tumbling US Treasury bond yields. As the Asian session begins, the USD/CAD exchanges hands at 1.3524 and continues to record losses by a minimal 0.01%.
Wall Street finished the session with solid gains amid the hype for NVIDIA reporting earnings, which were outstanding, keeping investors’ appetite for risk high. S&P Global revealed US PMIs, which showcased an economic deceleration, seen by traders as a sign the US Federal Reserve would decide to pause or end its tightening cycle.
Worth noting that Services and Composite PMIs stood at expansionary territory but at the brisk of falling below the 50-line, seen as the expansion/contraction level. On the contrary, the Manufacturing PMI fell further into contractionary territory; compared to July 49.0, it was 47.0.
Further data witnessed US New Home Sales rose by 4.4%, from a -2.8% plunge in June. Aside from this, US Treasury bond yields plummeted, with the US 10-year benchmark note rate falling more than ten basis points, finishing Wednesday’s session at 4.195%.
Across the border, Canadian Retail Sales edged up as car sales climbed. Retail Sales rose by 0.1% MoM, exceeding estimates of 0%, while excluding autos plummeted to -0.8% MoM, below forecasts of a 0.3% increase. Even though it was a mixed report, the USD/CAD did not blink, as the downtrend continued during Wednesday’s North American session.
Given an absent economic calendar in Canada, the USD/CAD would be subject to US Dollar dynamics amid a busy calendar. On Thursday, the US docket would reveal Durable Goods Orders and Initial Jobless Claims for the week ending August 19. All that ahead of the awaited Federal Reserve Chair Jerome Powell’s speech at Jackson Hole on August 25.
Technical Levels: Supports and Resistances
USDCAD currently trading at 1.3525 at the time of writing. Pair opened at 1.355 and is trading with a change of -0.18 % .
| Overview | Overview.1 | |
|---|---|---|
| 0 | Today last price | 1.3525 |
| 1 | Today Daily Change | -0.0025 |
| 2 | Today Daily Change % | -0.1800 |
| 3 | Today daily open | 1.3550 |
The pair remains strongly bullish on the daily timeframe. It trades above its 20 SMA @ 1.3401, 50 SMA 1.329, 100 SMA @ 1.3387 and 200 SMA @ 1.3456.
| Trends | Trends.1 | |
|---|---|---|
| 0 | Daily SMA20 | 1.3401 |
| 1 | Daily SMA50 | 1.3290 |
| 2 | Daily SMA100 | 1.3387 |
| 3 | Daily SMA200 | 1.3456 |
The previous day high was 1.3565 while the previous day low was 1.3513. The daily 38.2% Fib levels comes at 1.3545, expected to provide resistance. Similarly, the daily 61.8% fib level is at 1.3533, expected to provide resistance.
Note the levels of interest below:
- Pivot support is noted at 1.352, 1.3491, 1.3468
- Pivot resistance is noted at 1.3573, 1.3595, 1.3625
| Levels | Levels.1 |
|---|---|
| Previous Daily High | 1.3565 |
| Previous Daily Low | 1.3513 |
| Previous Weekly High | 1.3575 |
| Previous Weekly Low | 1.3437 |
| Previous Monthly High | 1.3387 |
| Previous Monthly Low | 1.3093 |
| Daily Fibonacci 38.2% | 1.3545 |
| Daily Fibonacci 61.8% | 1.3533 |
| Daily Pivot Point S1 | 1.3520 |
| Daily Pivot Point S2 | 1.3491 |
| Daily Pivot Point S3 | 1.3468 |
| Daily Pivot Point R1 | 1.3573 |
| Daily Pivot Point R2 | 1.3595 |
| Daily Pivot Point R3 | 1.3625 |
[/s2If]
Download Nehcap EAWe have two EAs that are operational on our LIVE accounts.
- EA-FIX: Check out the details here. Download EA-FIX . EA-FIX is a non-grid HFT scalper.
- EA-GROWTH: High quality low dd EA using trend grids. Download EA_GROWTHJoin Our Telegram Group
")


