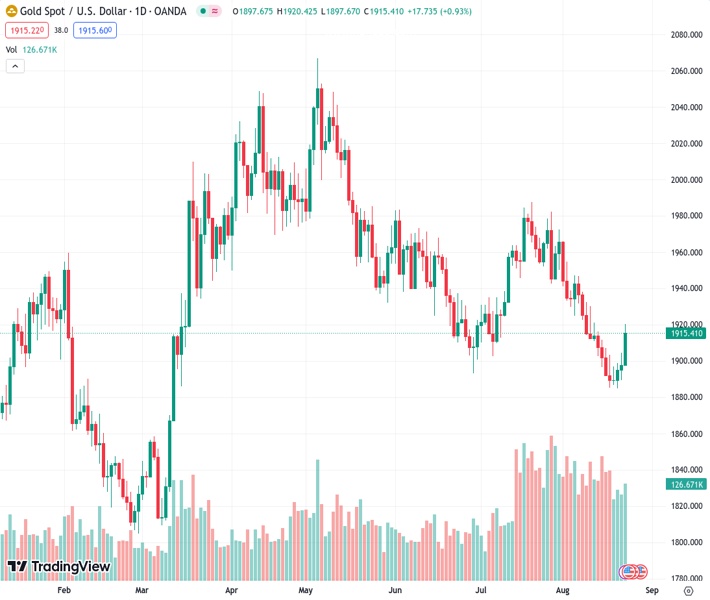
The price of XAUUSD at 1,915.20 increased above the 200-day simple moving average (SMA), but it was unable to surpass the 20-day average and ultimately closed at $1,915.
…
This is a premium post.
[s2If !current_user_can(access_s2member_level4)]Please register for FREE REGISTER to read full post below containing analysis. In case of any error or you think you are not able to read the full post below, please email us at support#nehcap.com [lwa][/s2If] [s2If current_user_can(access_s2member_level1)]
- XAU/USD rose above the 200-day SMA but was rejected by the 20-day average, settling at $1,915.
The pair currently trades last at 1915.20.
The previous day high was 1904.51 while the previous day low was 1889.14. The daily 38.2% Fib levels comes at 1898.64, expected to provide support. Similarly, the daily 61.8% fib level is at 1895.01, expected to provide support.
In Tuesday’s session, the XAU/USD Gold spot price found demand as the leading world economies showed weak economic activity figures, which fueled a decline in global Treasury yields. Precious metals rallied, with Silver leading the day and showing more than 3% gains.
The US S&P Global PMIs came in soft. The Manufacturing PMI dropped to 47 vs. the 49.3 expected, while the Services index remained in expansion territory at 51 despite coming lower than expected.
As a reaction, US bond yields are often seen as the opportunity cost of holding non-yielding metals, declined as investors seem to be betting on a less aggressive Federal Reserve (Fed). The 2-year yield dropped to 4.97% while the 5 and 10-year rates to 4.37% and 4.19%, respectively, showing more than 1% declines. Indeed, the CME FedWatch tool indicates that the odds of a 25 basis point hike in the upcoming November meeting eased to 35% from 40% at the start of the week while markets remain confident that the Fed will pause in September. On the USD DXY index side, it found resistance at the 104.00 level and settled near 103.60 following the data.
The focus now shifts to Jerome Powell’s speech on Friday, where investors will look for further clues on the next moves by the Fed. Weekly Jobless Claims on Thursday from the US will also be closely watched.
With both the Relative Strength Index (RSI) and the Moving Average Convergence Divergence (MACD) comfortably placed in positive territory on the daily chart, the XAU/USD buyers hold the upperhand. The upward slope of the RSI further reinforces this positive sentiment, as does the MACD, which displays green bars, indicating a strengthening bullish momentum. Additionally, the pair is above the 20,100,200-day Simple Moving Averages (SMAs), implying that the bulls retain control on a broader scale.
Support levels: $1,910 (200-day SMA), $1,900, $1,880.
Resistance levels: $1,920 (20-day SMA), $1,950, $1,970.
Technical Levels: Supports and Resistances
XAUUSD currently trading at 1915.6 at the time of writing. Pair opened at 1897.48 and is trading with a change of 0.95 % .
| Overview | Overview.1 | |
|---|---|---|
| 0 | Today last price | 1915.60 |
| 1 | Today Daily Change | 18.12 |
| 2 | Today Daily Change % | 0.95 |
| 3 | Today daily open | 1897.48 |
The pair is trading below its 20 Daily moving average @ 1923.65, below its 50 Daily moving average @ 1932.96 , below its 100 Daily moving average @ 1961.05 and above its 200 Daily moving average @ 1907.98
| Trends | Trends.1 | |
|---|---|---|
| 0 | Daily SMA20 | 1923.65 |
| 1 | Daily SMA50 | 1932.96 |
| 2 | Daily SMA100 | 1961.05 |
| 3 | Daily SMA200 | 1907.98 |
The previous day high was 1904.51 while the previous day low was 1889.14. The daily 38.2% Fib levels comes at 1898.64, expected to provide support. Similarly, the daily 61.8% fib level is at 1895.01, expected to provide support.
Note the levels of interest below:
- Pivot support is noted at 1889.58, 1881.67, 1874.21
- Pivot resistance is noted at 1904.95, 1912.41, 1920.32
| Levels | Levels.1 |
|---|---|
| Previous Daily High | 1904.51 |
| Previous Daily Low | 1889.14 |
| Previous Weekly High | 1916.29 |
| Previous Weekly Low | 1885.13 |
| Previous Monthly High | 1987.54 |
| Previous Monthly Low | 1902.77 |
| Daily Fibonacci 38.2% | 1898.64 |
| Daily Fibonacci 61.8% | 1895.01 |
| Daily Pivot Point S1 | 1889.58 |
| Daily Pivot Point S2 | 1881.67 |
| Daily Pivot Point S3 | 1874.21 |
| Daily Pivot Point R1 | 1904.95 |
| Daily Pivot Point R2 | 1912.41 |
| Daily Pivot Point R3 | 1920.32 |
[/s2If]
Download Nehcap EAWe have two EAs that are operational on our LIVE accounts.
- EA-FIX: Check out the details here. Download EA-FIX . EA-FIX is a non-grid HFT scalper.
- EA-GROWTH: High quality low dd EA using trend grids. Download EA_GROWTHJoin Our Telegram Group
")


