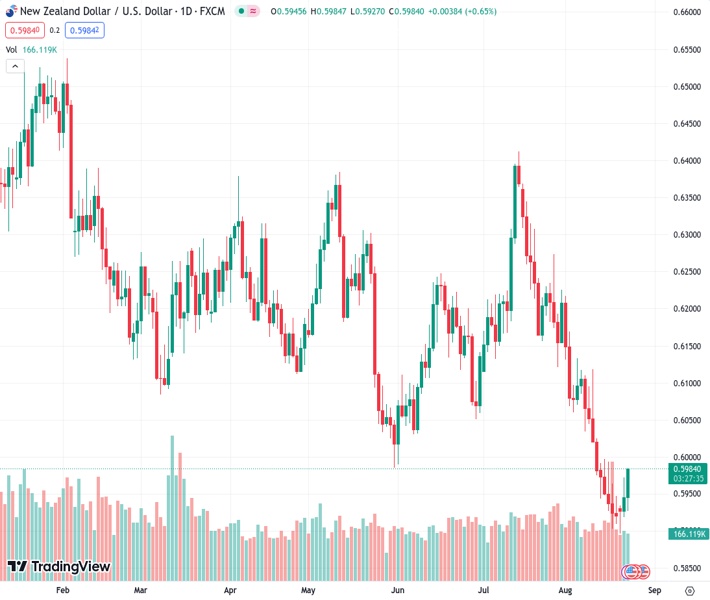
The NZDUSD pair, currently at 0.59829, experienced a strong increase above the 0.5980 level, marking a consecutive three-day period of gains.
…
This is a premium post.
[s2If !current_user_can(access_s2member_level4)]Please register for FREE REGISTER to read full post below containing analysis. In case of any error or you think you are not able to read the full post below, please email us at support#nehcap.com [lwa][/s2If] [s2If current_user_can(access_s2member_level1)]
- NZD/USD surged above the 0.5980 area, setting a three-day winning streak.
The pair currently trades last at 0.59829.
The previous day high was 0.5973 while the previous day low was 0.5918. The daily 38.2% Fib levels comes at 0.5952, expected to provide support. Similarly, the daily 61.8% fib level is at 0.5939, expected to provide support.
In Wednesday’s session, the NZD/USD recovered ground, driven by a weak USD following the release of August S&P PMIs. Due to signs of a softening economy, US yields took a big hit, and markets seem to be betting on a less aggressive Federal Reserve (Fed). Investors now focus on Friday’s speech from Jerome Powell at the Jackson Hole Symposium.
The US Manufacturing PMI from August declined to 47, as opposed to the expected 49.3, while the Services index remained within the expansion category at 51 despite being lower than anticipated.
As the Federal Reserve (Fed) stated, decisions will depend on incoming data, weak PMI figures make markets bet that the Fed won’t be as aggressive as expected, and the US yields are showing sharp declines. With the 2, 5 and 10-year rates falling by more than 1%, the USD loses interest and trades weak against most of its rivals, and the DXY index fell towards the 103.30 area.
In line with that, according to the CME FedWatch tool, investors still are confident that the Fed won’t hike in September, while the odds of a hike in November fell to 35%.
The daily chart analysis suggests a neutral to bullish outlook for NZD/USD, with the bulls gaining strength, although challenges persist. With a positive slope below its midline, the Relative Strength Index (RSI) signals a strengthening bullish sentiment, while the Moving Average Convergence (MACD) prints shorter red bars. Furthermore, the pair is below the 20,100 and 200-day Simple Moving Averages (SMAs), suggesting that the buyers are struggling to overcome the overall bearish trend and that the bears are still in charge.
Support levels: 0.6000, 0.6015, 0.6035 (20-day SMA)
Resistance levels: 0.5950, 0.5930, 0.5910.
Technical Levels: Supports and Resistances
NZDUSD currently trading at 0.5979 at the time of writing. Pair opened at 0.5946 and is trading with a change of 0.55 % .
| Overview | Overview.1 | |
|---|---|---|
| 0 | Today last price | 0.5979 |
| 1 | Today Daily Change | 0.0033 |
| 2 | Today Daily Change % | 0.5500 |
| 3 | Today daily open | 0.5946 |
The pair remains strongly bearish on the daily time frame. It trades below the 20 SMA @ 0.6048, 50 SMA 0.6142, 100 SMA @ 0.6162 and 200 SMA @ 0.623.
| Trends | Trends.1 | |
|---|---|---|
| 0 | Daily SMA20 | 0.6048 |
| 1 | Daily SMA50 | 0.6142 |
| 2 | Daily SMA100 | 0.6162 |
| 3 | Daily SMA200 | 0.6230 |
The previous day high was 0.5973 while the previous day low was 0.5918. The daily 38.2% Fib levels comes at 0.5952, expected to provide support. Similarly, the daily 61.8% fib level is at 0.5939, expected to provide support.
Note the levels of interest below:
- Pivot support is noted at 0.5918, 0.5891, 0.5863
- Pivot resistance is noted at 0.5973, 0.6001, 0.6028
| Levels | Levels.1 |
|---|---|
| Previous Daily High | 0.5973 |
| Previous Daily Low | 0.5918 |
| Previous Weekly High | 0.5997 |
| Previous Weekly Low | 0.5903 |
| Previous Monthly High | 0.6413 |
| Previous Monthly Low | 0.6120 |
| Daily Fibonacci 38.2% | 0.5952 |
| Daily Fibonacci 61.8% | 0.5939 |
| Daily Pivot Point S1 | 0.5918 |
| Daily Pivot Point S2 | 0.5891 |
| Daily Pivot Point S3 | 0.5863 |
| Daily Pivot Point R1 | 0.5973 |
| Daily Pivot Point R2 | 0.6001 |
| Daily Pivot Point R3 | 0.6028 |
[/s2If]
Download Nehcap EAWe have two EAs that are operational on our LIVE accounts.
- EA-FIX: Check out the details here. Download EA-FIX . EA-FIX is a non-grid HFT scalper.
- EA-GROWTH: High quality low dd EA using trend grids. Download EA_GROWTHJoin Our Telegram Group
")


