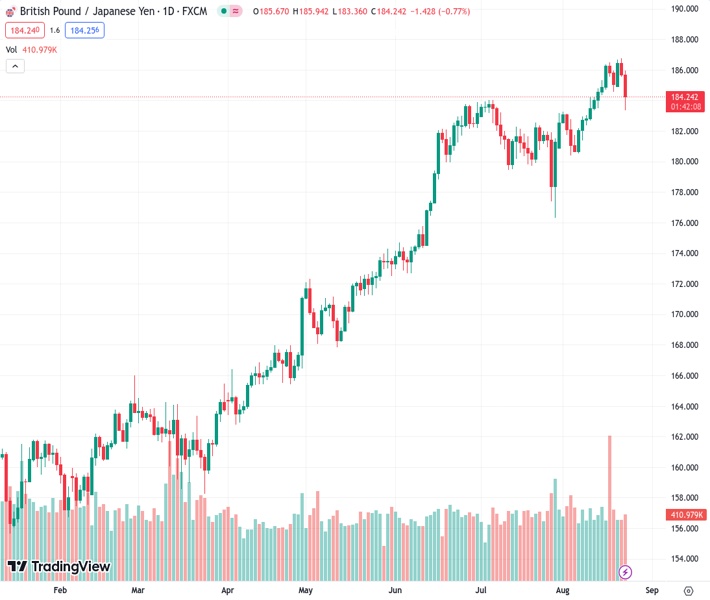
The GBPJPY currency pair reached a level of 184.246 and then had a trial run at the 20-day Simple Moving Average (SMA) at 183.30 before eventually stabilizing above 184.00.
…
This is a premium post.
[s2If !current_user_can(access_s2member_level4)]Please register for FREE REGISTER to read full post below containing analysis. In case of any error or you think you are not able to read the full post below, please email us at support#nehcap.com [lwa][/s2If] [s2If current_user_can(access_s2member_level1)]
- GBP/JPY tested the 20-day SMA at 183.30 and then settled above 184.00.
The pair currently trades last at 184.246.
The previous day high was 186.77 while the previous day low was 185.54. The daily 38.2% Fib levels comes at 186.01, expected to provide resistance. Similarly, the daily 61.8% fib level is at 186.3, expected to provide resistance.
The JPY is trading strong against most of its rivals, including the USD, GBP, EUR and AUD, as its PMIs showed better-than-expected results in August. On the other hand, the UK reported soft PMIs from August, which made the Pound lose interest in the FX markets.
British PMIs from August showed poor results. The Manufacturing declined deep into negative territory and fell to 42.5, while the Services PMI dropped below the 50 threshold to 48.7, both coming lower than expected. It’s worth noticing that the Bank of England (BoE), in its last meeting, stated that it no longer expects a recession, so weak data seem to be surprising the markets.
The British yields show sharp declines as a reaction, with the Bank of England’s tightening expectations falling slightly. That being said, investors continue to price in higher odds of a terminal rate of 6% for this cycle.
On the Japanese side, the Jibun Bank PMIs came in higher than expected, but the Manufacturing PMIs remained in contraction territory while the Service index stood above 50 in August. Furthermore, the JPY has gained traction on the back of the rise of the Japanese government yields, which stood at highs since 2014, and markets are pledging the Bank of Japan (BoJ) to pivot. That being said, no signs have been given by the Japanese banking authority, which seems to be comfortable maintaining its negative interest rate policy, so divergences from the BoJ and its peers may limit the upside for the Yen.
The daily chart shows signs of bullish exhaustion for GBP/JPY, contributing to a neutral, bearish technical stance. Both the Relative Strength Index (RSI) and Moving Average Convergence Divergence (MACD) exhibit indications of fading momentum. The RSI has a negative slope above its midline, indicating weakening buying pressure, while the Moving Average Convergence (MACD) presents shorter green bars. On the bigger picture, the pair is above the 20,100,200-day Simple Moving Average (SMAs), indicating that the buyers are commanding the broader perspective.
Support levels: 183.30 (20-day SMA), 183.00, 182.50
Resistance levels: 184.00, 184.50, 185.00.
Technical Levels: Supports and Resistances
GBPJPY currently trading at 184.24 at the time of writing. Pair opened at 185.75 and is trading with a change of -0.81 % .
| Overview | Overview.1 | |
|---|---|---|
| 0 | Today last price | 184.24 |
| 1 | Today Daily Change | -1.51 |
| 2 | Today Daily Change % | -0.81 |
| 3 | Today daily open | 185.75 |
The pair remains strongly bullish on the daily timeframe. It trades above its 20 SMA @ 183.28, 50 SMA 182.39, 100 SMA @ 176.24 and 200 SMA @ 169.29.
| Trends | Trends.1 | |
|---|---|---|
| 0 | Daily SMA20 | 183.28 |
| 1 | Daily SMA50 | 182.39 |
| 2 | Daily SMA100 | 176.24 |
| 3 | Daily SMA200 | 169.29 |
The previous day high was 186.77 while the previous day low was 185.54. The daily 38.2% Fib levels comes at 186.01, expected to provide resistance. Similarly, the daily 61.8% fib level is at 186.3, expected to provide resistance.
Note the levels of interest below:
- Pivot support is noted at 185.27, 184.78, 184.03
- Pivot resistance is noted at 186.5, 187.26, 187.74
| Levels | Levels.1 |
|---|---|
| Previous Daily High | 186.77 |
| Previous Daily Low | 185.54 |
| Previous Weekly High | 186.47 |
| Previous Weekly Low | 183.46 |
| Previous Monthly High | 184.02 |
| Previous Monthly Low | 176.32 |
| Daily Fibonacci 38.2% | 186.01 |
| Daily Fibonacci 61.8% | 186.30 |
| Daily Pivot Point S1 | 185.27 |
| Daily Pivot Point S2 | 184.78 |
| Daily Pivot Point S3 | 184.03 |
| Daily Pivot Point R1 | 186.50 |
| Daily Pivot Point R2 | 187.26 |
| Daily Pivot Point R3 | 187.74 |
[/s2If]
Download Nehcap EAWe have two EAs that are operational on our LIVE accounts.
- EA-FIX: Check out the details here. Download EA-FIX . EA-FIX is a non-grid HFT scalper.
- EA-GROWTH: High quality low dd EA using trend grids. Download EA_GROWTHJoin Our Telegram Group
")


