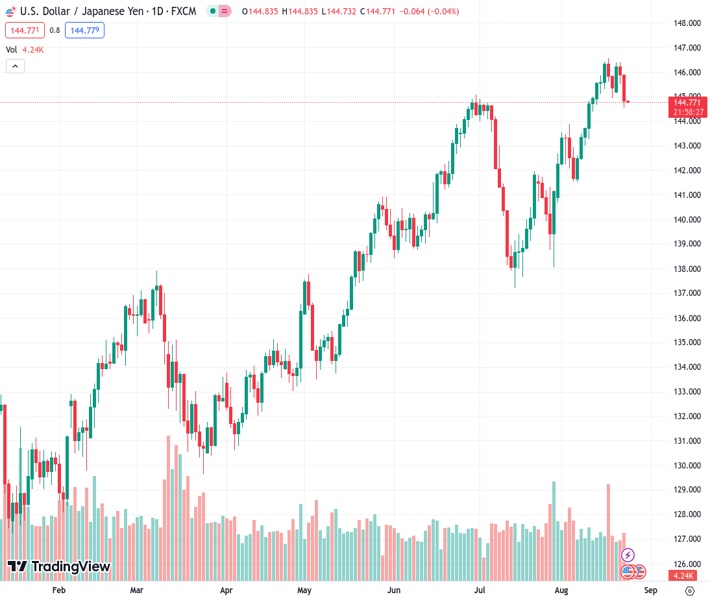
The currency pair USDJPY is currently trading at 144.79, down by 0.72% from its previous level of 144.796. The decline is attributed to decreasing US bond yields along with weak economic data, which are exerting downward pressure on the pair.
…
This is a premium post.
[s2If !current_user_can(access_s2member_level4)]Please register for FREE REGISTER to read full post below containing analysis. In case of any error or you think you are not able to read the full post below, please email us at support#nehcap.com [lwa][/s2If] [s2If current_user_can(access_s2member_level1)]
- USD/JPY down 0.72%, trading at 144.79, as falling US bond yields and soft economic data put pressure on the pair.
The pair currently trades last at 144.796.
The previous day high was 146.4 while the previous day low was 145.5. The daily 38.2% Fib levels comes at 145.84, expected to provide resistance. Similarly, the daily 61.8% fib level is at 146.06, expected to provide resistance.
USD/JPY retraced its earlier weekly gains, as the pair printed losses of 0.72% on Wednesday, courtesy of falling US bond yields, as US economic data was soft. As Thursday’s Asian session begins, the USD/JPY is trading at 144.79, down by a minimal 0.03%.
The USD/JPY is neutral to upward biased, but its fall below the Tenkan-Sen line at 145.54 opened the door for further losses. Price action is closing its distance from the Ichimoku Cloud (Kumo), which is still below the exchange rate, maintaining the bullish stance in the pair. But, given the USD/JPY slipped below the June 30 daily high and turned support at 145.07, it suggests the pair could extend its losses.
Short term, the USD/JPY hourly chart depicts the pair as bearish biased due to several technical indications: the Kijun-Sen is above the Tenkan-Sen line, usually the first sign of a change in the trend, followed by the Chikou Span breach below the price action, two days ago. That warrants further downside, alongside USD/JPY sliding below the Kumo.
First support would be the August 23 swing low of 144.54, followed by the August 10 daily low of 143.26. A decisive break and the USD/JPY could aim towards the 143.00 mark.
Technical Levels: Supports and Resistances
USDJPY currently trading at 144.79 at the time of writing. Pair opened at 145.89 and is trading with a change of -0.75 % .
| Overview | Overview.1 | |
|---|---|---|
| 0 | Today last price | 144.79 |
| 1 | Today Daily Change | -1.10 |
| 2 | Today Daily Change % | -0.75 |
| 3 | Today daily open | 145.89 |
The pair remains strongly bullish on the daily timeframe. It trades above its 20 SMA @ 143.72, 50 SMA 142.57, 100 SMA @ 139.47 and 200 SMA @ 136.6.
| Trends | Trends.1 | |
|---|---|---|
| 0 | Daily SMA20 | 143.72 |
| 1 | Daily SMA50 | 142.57 |
| 2 | Daily SMA100 | 139.47 |
| 3 | Daily SMA200 | 136.60 |
The previous day high was 146.4 while the previous day low was 145.5. The daily 38.2% Fib levels comes at 145.84, expected to provide resistance. Similarly, the daily 61.8% fib level is at 146.06, expected to provide resistance.
Note the levels of interest below:
- Pivot support is noted at 145.46, 145.03, 144.56
- Pivot resistance is noted at 146.36, 146.83, 147.27
| Levels | Levels.1 |
|---|---|
| Previous Daily High | 146.40 |
| Previous Daily Low | 145.50 |
| Previous Weekly High | 146.56 |
| Previous Weekly Low | 144.65 |
| Previous Monthly High | 144.91 |
| Previous Monthly Low | 137.24 |
| Daily Fibonacci 38.2% | 145.84 |
| Daily Fibonacci 61.8% | 146.06 |
| Daily Pivot Point S1 | 145.46 |
| Daily Pivot Point S2 | 145.03 |
| Daily Pivot Point S3 | 144.56 |
| Daily Pivot Point R1 | 146.36 |
| Daily Pivot Point R2 | 146.83 |
| Daily Pivot Point R3 | 147.27 |
[/s2If]
Download Nehcap EAWe have two EAs that are operational on our LIVE accounts.
- EA-FIX: Check out the details here. Download EA-FIX . EA-FIX is a non-grid HFT scalper.
- EA-GROWTH: High quality low dd EA using trend grids. Download EA_GROWTHJoin Our Telegram Group
")


