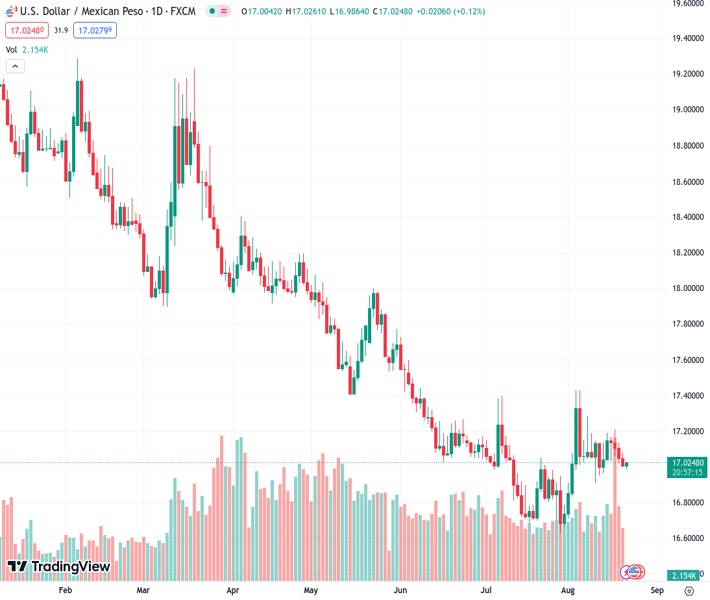
The USDMXN pair is currently staying at a one-week low of 17.0240, following a decline over the past four days. According to @nehcap, it is anticipated that there will be further downward movement.
…
This is a premium post.
[s2If !current_user_can(access_s2member_level4)]Please register for FREE REGISTER to read full post below containing analysis. In case of any error or you think you are not able to read the full post below, please email us at support#nehcap.com [lwa][/s2If] [s2If current_user_can(access_s2member_level1)]
- USD/MXN remains sidelined at one-week low after declining in the last four consecutive days.
The pair currently trades last at 17.0240.
The previous day high was 17.1366 while the previous day low was 17.0167. The daily 38.2% Fib levels comes at 17.0625, expected to provide resistance. Similarly, the daily 61.8% fib level is at 17.0908, expected to provide resistance.
USD/MXN bears take a breather around 17.00, positing the first daily positive in five amid concerns about the US–Mexico trade disputes. That said, the Mexican Peso’s latest tension erupts on comments from Mexican Economy Minister Raquel Buenrostro.
Late Monday, Mexico’s Buenrostro refrained from altering the decree on genetically modified (GM) corn ahead of a dispute settlement panel requested by the United States through the USMCA trade pact, per Reuters.
The news cites the US-Mexico tension that ignited after the US objected to the restrictions imposed by Mexico on imports of GM corn and requested a dispute settlement panel under the North American trade pact.
With this, the USD/MXN traders also take clues from the cautious markets and a light calendar to allow the Mexican Peso (MXN) in paring the latest gains amid sluggish markets.
Also read: USD/MXN sees uptick amid China’s economic concerns, ahead Powell’s Jackson Hole speech
USD/MXN bears struggle to keep the reins as a convergence of the 50-DMA and the 21-DMA, around 17.00 puts a floor under the Mexican Peso (MXN) pair.
However, the previous week’s downside break of an ascending trend line from July 28 joins an impending bear cross on the MACD to lure the USD/MXN pair sellers.
With this, the Mexican Peso buyers can aim for 16.80 and 16.70 levels toward the south on breaking the 17.00 hurdle. However, the latest multi-year low marked in July around 16.62 will challenge the USD/MXN pair sellers afterward.
On the contrary, the quote’s recovery remains elusive unless crossing the previous support, around 17.15 by the press time.
Following that, the monthly high of around 17.42 will act as the final defense of the USD/MXN bears.
Trend: Further downside expected
Technical Levels: Supports and Resistances
USDMXN currently trading at 17.0228 at the time of writing. Pair opened at 17.057 and is trading with a change of -0.20% % .
| Overview | Overview.1 | |
|---|---|---|
| 0 | Today last price | 17.0228 |
| 1 | Today Daily Change | -0.0342 |
| 2 | Today Daily Change % | -0.20% |
| 3 | Today daily open | 17.057 |
The pair is trading above its 20 Daily moving average @ 17.0056, below its 50 Daily moving average @ 17.0284 , below its 100 Daily moving average @ 17.4305 and below its 200 Daily moving average @ 18.1906
| Trends | Trends.1 | |
|---|---|---|
| 0 | Daily SMA20 | 17.0056 |
| 1 | Daily SMA50 | 17.0284 |
| 2 | Daily SMA100 | 17.4305 |
| 3 | Daily SMA200 | 18.1906 |
The previous day high was 17.1366 while the previous day low was 17.0167. The daily 38.2% Fib levels comes at 17.0625, expected to provide resistance. Similarly, the daily 61.8% fib level is at 17.0908, expected to provide resistance.
Note the levels of interest below:
- Pivot support is noted at 17.0036, 16.9502, 16.8837
- Pivot resistance is noted at 17.1235, 17.19, 17.2434
| Levels | Levels.1 |
|---|---|
| Previous Daily High | 17.1366 |
| Previous Daily Low | 17.0167 |
| Previous Weekly High | 17.2094 |
| Previous Weekly Low | 16.9663 |
| Previous Monthly High | 17.3957 |
| Previous Monthly Low | 16.6258 |
| Daily Fibonacci 38.2% | 17.0625 |
| Daily Fibonacci 61.8% | 17.0908 |
| Daily Pivot Point S1 | 17.0036 |
| Daily Pivot Point S2 | 16.9502 |
| Daily Pivot Point S3 | 16.8837 |
| Daily Pivot Point R1 | 17.1235 |
| Daily Pivot Point R2 | 17.1900 |
| Daily Pivot Point R3 | 17.2434 |
[/s2If]
Download Nehcap EAWe have two EAs that are operational on our LIVE accounts.
- EA-FIX: Check out the details here. Download EA-FIX . EA-FIX is a non-grid HFT scalper.
- EA-GROWTH: High quality low dd EA using trend grids. Download EA_GROWTHJoin Our Telegram Group
")


