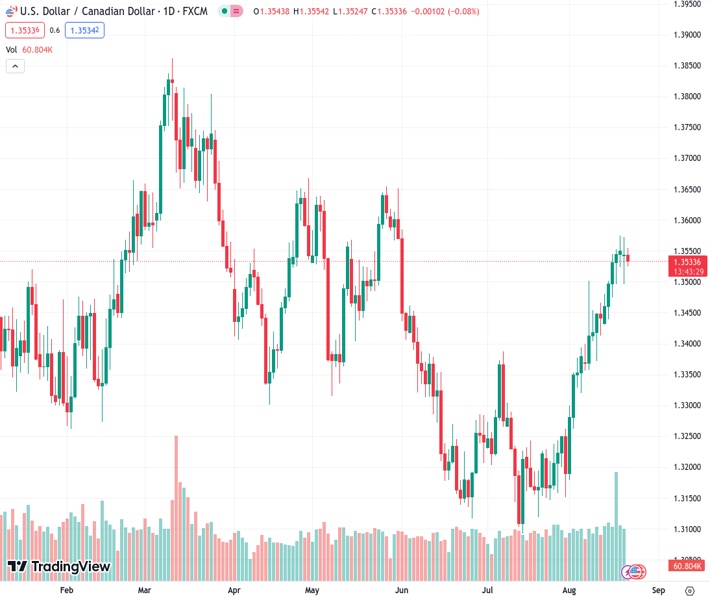
The USDCAD currency pair is facing difficulty in increasing and remains below the mid 1.3500s level during the beginning of the European trading session.
…
This is a premium post.
[s2If !current_user_can(access_s2member_level4)]Please register for FREE REGISTER to read full post below containing analysis. In case of any error or you think you are not able to read the full post below, please email us at support#nehcap.com [lwa][/s2If] [s2If current_user_can(access_s2member_level1)]
- USD/CAD struggles to gain and holds below the mid 1.3500s in the early European session.
The pair currently trades last at 1.35309.
The previous day high was 1.3573 while the previous day low was 1.3496. The daily 38.2% Fib levels comes at 1.3525, expected to provide support. Similarly, the daily 61.8% fib level is at 1.3543, expected to provide resistance.
The USD/CAD pair loses traction and edges lower to 1.3532 heading into the early European session on Tuesday. Investors will look to Friday’s speech by Fed Chairman Jerome Powell for direction and perhaps insight into the state of the economy. Market participants are placing bets on a 40% likelihood of a last Fed rise by November, according to Reuters.
From the technical perspective, USD/CAD trades within the ascending trend-channel since August 9 on the one-hour chart. Further downside for USD/CAD looks favorable as the pair holds below the 50-hour Exponential Moving Average (EMA). Meanwhile, the Relative Strength Index (RSI) stands below 50, activating the bearish momentum for the USD/CAD pair for the time being.
That said, the critical support zone for USD/CAD is located at 1.3495-1.3510, portraying a confluence of a lower line of an ascending trend-channel, a low of August 21, and a psychological round figure. Further south, the next stop to watch is at 1.3475 (Low of August 16) en route to 1.3445 (Low of August 15) and finally at 1.3410 (Low of August 11).
On the upside, the immediate resistance level for the pair is seen at 1.3575 (high of August 18). The key barrier to watch is the upper boundary of the ascending trend-channel and psychological figure at 1.3600. Any follow-through buying above the latter will see a rally to 1.3650 (a high of May 31).
Technical Levels: Supports and Resistances
USDCAD currently trading at 1.3533 at the time of writing. Pair opened at 1.3545 and is trading with a change of -0.09 % .
| Overview | Overview.1 | |
|---|---|---|
| 0 | Today last price | 1.3533 |
| 1 | Today Daily Change | -0.0012 |
| 2 | Today Daily Change % | -0.0900 |
| 3 | Today daily open | 1.3545 |
The pair remains strongly bullish on the daily timeframe. It trades above its 20 SMA @ 1.3382, 50 SMA 1.3285, 100 SMA @ 1.3386 and 200 SMA @ 1.3454.
| Trends | Trends.1 | |
|---|---|---|
| 0 | Daily SMA20 | 1.3382 |
| 1 | Daily SMA50 | 1.3285 |
| 2 | Daily SMA100 | 1.3386 |
| 3 | Daily SMA200 | 1.3454 |
The previous day high was 1.3573 while the previous day low was 1.3496. The daily 38.2% Fib levels comes at 1.3525, expected to provide support. Similarly, the daily 61.8% fib level is at 1.3543, expected to provide resistance.
Note the levels of interest below:
- Pivot support is noted at 1.3503, 1.3461, 1.3426
- Pivot resistance is noted at 1.358, 1.3614, 1.3656
| Levels | Levels.1 |
|---|---|
| Previous Daily High | 1.3573 |
| Previous Daily Low | 1.3496 |
| Previous Weekly High | 1.3575 |
| Previous Weekly Low | 1.3437 |
| Previous Monthly High | 1.3387 |
| Previous Monthly Low | 1.3093 |
| Daily Fibonacci 38.2% | 1.3525 |
| Daily Fibonacci 61.8% | 1.3543 |
| Daily Pivot Point S1 | 1.3503 |
| Daily Pivot Point S2 | 1.3461 |
| Daily Pivot Point S3 | 1.3426 |
| Daily Pivot Point R1 | 1.3580 |
| Daily Pivot Point R2 | 1.3614 |
| Daily Pivot Point R3 | 1.3656 |
[/s2If]
Download Nehcap EAWe have two EAs that are operational on our LIVE accounts.
- EA-FIX: Check out the details here. Download EA-FIX . EA-FIX is a non-grid HFT scalper.
- EA-GROWTH: High quality low dd EA using trend grids. Download EA_GROWTHJoin Our Telegram Group
")


