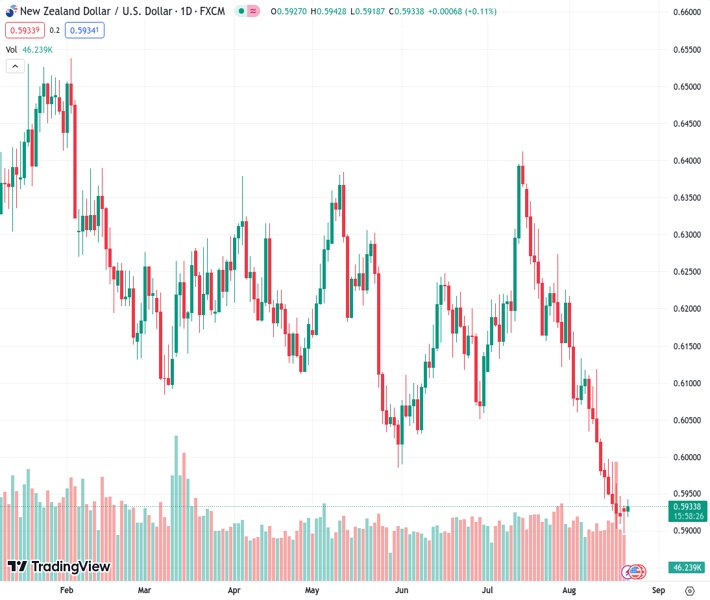
The NZDUSD currency pair, currently trading at 0.59327, is holding onto slight gains and protecting its recent rebound from the year-to-date low it reached on Monday. According to Nehcap, it is anticipated that there will be a continued improvement in the currency’s value.
…
This is a premium post.
[s2If !current_user_can(access_s2member_level4)]Please register for FREE REGISTER to read full post below containing analysis. In case of any error or you think you are not able to read the full post below, please email us at support#nehcap.com [lwa][/s2If] [s2If current_user_can(access_s2member_level1)]
- NZD/USD clings to mild gains defends late Monday’s rebound from YTD low.
The pair currently trades last at 0.59327.
The previous day high was 0.5936 while the previous day low was 0.5895. The daily 38.2% Fib levels comes at 0.591, expected to provide support. Similarly, the daily 61.8% fib level is at 0.592, expected to provide support.
NZD/USD seesaws around intraday high surrounding 0.5940-35 heading into Tuesday’s European session.
In doing so, the Kiwi pair defends the previous day’s corrective bounce off the lowest level since November 2022, as well as an upside break of a fortnight-long resistance line. Adding strength to the upside bias are the bullish MACD signals.
With this, the NZD/USD buyers can consider the latest retreat as a buying opportunity while targeting the 50-SMA hurdle of 0.5960.
However, a downward-sloping resistance line from early August, around 0.5975 at the latest, restricts the Kiwi pair’s further upside.
It’s worth mentioning that multiple tops marked since August 11, close to 0.5995–6000 act as additional upside filters for the NZD/USD bulls.
Meanwhile, pullback moves remain elusive unless the quote stays beyond the two-week-old previous resistance line, near 0.5920 at the latest.
Following that, double bottoms marked around 0.5900 will act as crucial support to watch for the NZD/USD bears.
In a case where the Kiwi sellers dominate past 0.5900, an early October 2022 swing high of around 0.5815 will be on their radars.
Trend: Further recovery expected
Technical Levels: Supports and Resistances
NZDUSD currently trading at 0.5936 at the time of writing. Pair opened at 0.5929 and is trading with a change of 0.12% % .
| Overview | Overview.1 | |
|---|---|---|
| 0 | Today last price | 0.5936 |
| 1 | Today Daily Change | 0.0007 |
| 2 | Today Daily Change % | 0.12% |
| 3 | Today daily open | 0.5929 |
The pair remains strongly bearish on the daily time frame. It trades below the 20 SMA @ 0.6062, 50 SMA 0.6146, 100 SMA @ 0.6166 and 200 SMA @ 0.6231.
| Trends | Trends.1 | |
|---|---|---|
| 0 | Daily SMA20 | 0.6062 |
| 1 | Daily SMA50 | 0.6146 |
| 2 | Daily SMA100 | 0.6166 |
| 3 | Daily SMA200 | 0.6231 |
The previous day high was 0.5936 while the previous day low was 0.5895. The daily 38.2% Fib levels comes at 0.591, expected to provide support. Similarly, the daily 61.8% fib level is at 0.592, expected to provide support.
Note the levels of interest below:
- Pivot support is noted at 0.5904, 0.5879, 0.5864
- Pivot resistance is noted at 0.5945, 0.596, 0.5985
| Levels | Levels.1 |
|---|---|
| Previous Daily High | 0.5936 |
| Previous Daily Low | 0.5895 |
| Previous Weekly High | 0.5997 |
| Previous Weekly Low | 0.5903 |
| Previous Monthly High | 0.6413 |
| Previous Monthly Low | 0.6120 |
| Daily Fibonacci 38.2% | 0.5910 |
| Daily Fibonacci 61.8% | 0.5920 |
| Daily Pivot Point S1 | 0.5904 |
| Daily Pivot Point S2 | 0.5879 |
| Daily Pivot Point S3 | 0.5864 |
| Daily Pivot Point R1 | 0.5945 |
| Daily Pivot Point R2 | 0.5960 |
| Daily Pivot Point R3 | 0.5985 |
[/s2If]
Download Nehcap EAWe have two EAs that are operational on our LIVE accounts.
- EA-FIX: Check out the details here. Download EA-FIX . EA-FIX is a non-grid HFT scalper.
- EA-GROWTH: High quality low dd EA using trend grids. Download EA_GROWTHJoin Our Telegram Group
")


