The GBPJPY currency pair, currently at 186.141, is experiencing a correction after reaching a new high that hasn’t been seen in several years. This correction is being influenced by an increasing desire for the Japanese Yen.
…
This is a premium post.
[s2If !current_user_can(access_s2member_level4)]Please register for FREE REGISTER to read full post below containing analysis. In case of any error or you think you are not able to read the full post below, please email us at support#nehcap.com [lwa][/s2If] [s2If current_user_can(access_s2member_level1)]
- GBP/JPY corrects from a fresh multi-year peak and is pressured by reviving demand for the JPY.
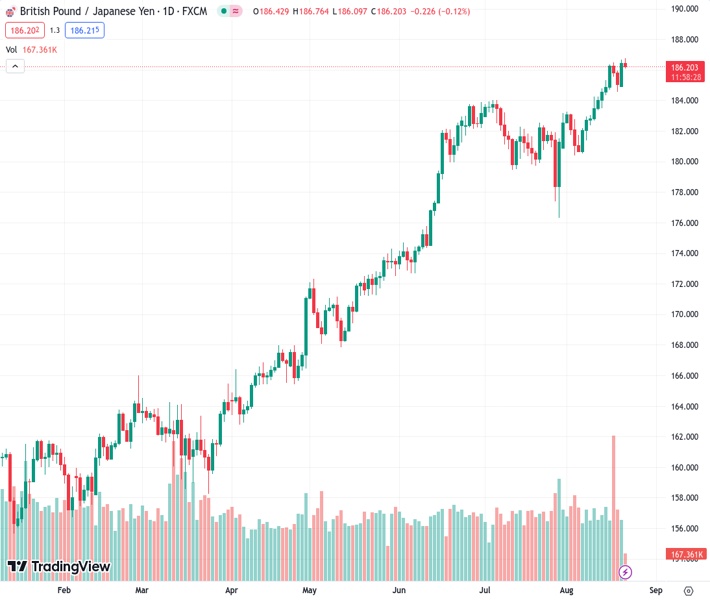
The pair currently trades last at 186.141.
The previous day high was 186.66 while the previous day low was 184.89. The daily 38.2% Fib levels comes at 185.99, expected to provide support. Similarly, the daily 61.8% fib level is at 185.57, expected to provide support.
The GBP/JPY cross attracts some intraday selling after touching its highest level since November 2015 this Tuesday and remains depressed through the early European session. Spot prices currently trade around the 186.30 region, down just over 0.10% for the day, though any meaningful corrective decline still seems elusive.
Against the backdrop of upward pressure in the global interest rates, the yield on the 10-year Japanese government bond (JGB) touches a new nine-year top on Tuesday and drives flows towards the Japanese Yen (JPY). Apart from this, speculations that the recent weakness in the domestic currency might prompt some jawboning from authorities, or an intervention in the foreign exchange markets, further underpins the JPY and act as a headwind for the GBP/JPY cross.
It is worth recalling that Japan’s top forex diplomat Masato Kanda said last week that he would take appropriate steps against excessive currency moves. Furthermore, a smaller rate by the People’s Bank of China (PBoC) on Monday signalled limited policy support for the economy and did little to ease worries about a deepening crisis in China’s property sector. This, in turn, benefits the JPY’s safe-haven status and contributes to the GBP/JPY pair’s pullback of over 50 pips.
That said, the Bank of Japan’s (BoJ) dovish outlook might keep a lid on any meaningful gains for the JPY. In fact, the BoJ is the only central bank in the world to maintain a negative benchmark interest rate. Moreover, policymakers have emphasised that a sustainable pay hike is a prerequisite to consider dismantling the massive monetary stimulus. This marks a big divergence in comparison to the Bank of England (BoE), which lifted its benchmark rate to a 15-year peak in August.
Moreover, the current market pricing indicates a more than 80% chance of a 25 bps lift-off at the next BoE policy meeting in September. The bets were lifted by the fact that wages in the UK touched a new record growth rate in the second quarter, which adds to worries about long-term inflation even after 14 consecutive rate hikes. Adding to this, the upbeat UK GDP report and slightly higher UK CPI print also support prospects for further policy tightening by the BoE.
The aforementioned fundamental backdrop suggests that the path of least resistance for the GBP/JPY cross is to the upside. Hence, any subsequent slide might still be seen as a buying opportunity and is more likely to remain limited in the absence of any relevant market-moving economic data on Tuesday. Traders might also prefer to wait on the sidelines ahead of the flash PMI prints on Wednesday and the crucial Jackson Hole Symposium later this week.
Technical Levels: Supports and Resistances
GBPJPY currently trading at 186.32 at the time of writing. Pair opened at 186.52 and is trading with a change of -0.11 % .
| Overview | Overview.1 | |
|---|---|---|
| 0 | Today last price | 186.32 |
| 1 | Today Daily Change | -0.20 |
| 2 | Today Daily Change % | -0.11 |
| 3 | Today daily open | 186.52 |
The pair remains strongly bullish on the daily timeframe. It trades above its 20 SMA @ 183.09, 50 SMA 182.21, 100 SMA @ 176.02 and 200 SMA @ 169.19.
| Trends | Trends.1 | |
|---|---|---|
| 0 | Daily SMA20 | 183.09 |
| 1 | Daily SMA50 | 182.21 |
| 2 | Daily SMA100 | 176.02 |
| 3 | Daily SMA200 | 169.19 |
The previous day high was 186.66 while the previous day low was 184.89. The daily 38.2% Fib levels comes at 185.99, expected to provide support. Similarly, the daily 61.8% fib level is at 185.57, expected to provide support.
Note the levels of interest below:
- Pivot support is noted at 185.39, 184.25, 183.61
- Pivot resistance is noted at 187.16, 187.8, 188.93
| Levels | Levels.1 |
|---|---|
| Previous Daily High | 186.66 |
| Previous Daily Low | 184.89 |
| Previous Weekly High | 186.47 |
| Previous Weekly Low | 183.46 |
| Previous Monthly High | 184.02 |
| Previous Monthly Low | 176.32 |
| Daily Fibonacci 38.2% | 185.99 |
| Daily Fibonacci 61.8% | 185.57 |
| Daily Pivot Point S1 | 185.39 |
| Daily Pivot Point S2 | 184.25 |
| Daily Pivot Point S3 | 183.61 |
| Daily Pivot Point R1 | 187.16 |
| Daily Pivot Point R2 | 187.80 |
| Daily Pivot Point R3 | 188.93 |
[/s2If]
Download Nehcap EAWe have two EAs that are operational on our LIVE accounts.
- EA-FIX: Check out the details here. Download EA-FIX . EA-FIX is a non-grid HFT scalper.
- EA-GROWTH: High quality low dd EA using trend grids. Download EA_GROWTHJoin Our Telegram Group
")


