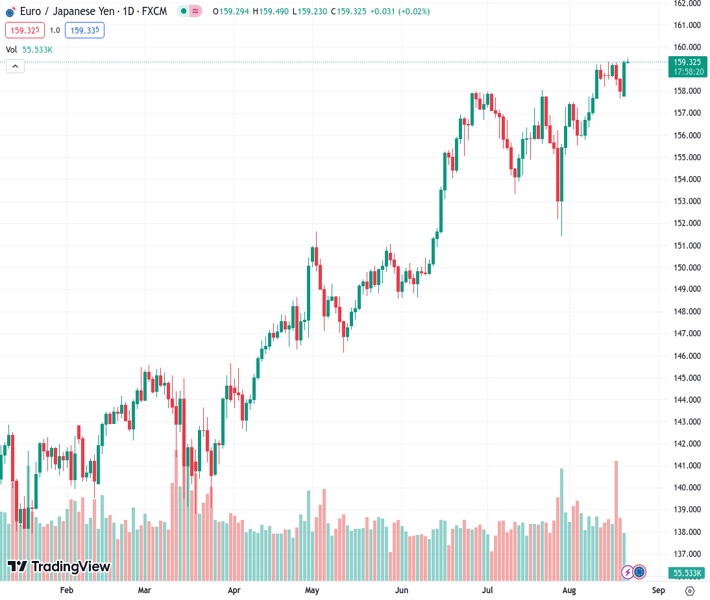
The EURJPY currency pair has retraced from its peak on Tuesday, which was the highest level it reached since September 2008.
…
This is a premium post.
[s2If !current_user_can(access_s2member_level4)]Please register for FREE REGISTER to read full post below containing analysis. In case of any error or you think you are not able to read the full post below, please email us at support#nehcap.com [lwa][/s2If] [s2If current_user_can(access_s2member_level1)]
- EUR/JPY pulls back from its highest level since September 2008 touched earlier this Tuesday.
The pair currently trades last at 159.328.
The previous day high was 159.4 while the previous day low was 157.8. The daily 38.2% Fib levels comes at 158.79, expected to provide support. Similarly, the daily 61.8% fib level is at 158.41, expected to provide support.
The EUR/JPY cross retreats a few pips after touching its highest level since September 2008 during the Asian session on Tuesday and currently trades around the 159.30 region, nearly unchanged for the day.
Concerns about the worsening economic conditions in China continue to weigh on investors’ sentiment, which is evident from a generally weaker tone around the equity markets and benefits the safe-haven Japanese Yen (JPY). Apart from this, speculations that the recent weakness in the domestic currency might prompt some jawboning from authorities, or an intervention in the foreign exchange markets, act as a headwind for the EUR/JPY cross.
A smaller rate by the People’s Bank of China (PBoC) on Monday signalled limited policy support for the economy and did little to ease worries about a deepening crisis in China’s property sector. Furthermore, Japan’s top forex diplomat Masato Kanda said last week that he would take appropriate steps against excessive currency moves. This, in turn, is seen lending some support to the JPY and holding back bulls from placing fresh bets around the EUR/JPY cross.
That said, a big divergence in the monetary policy stance adopted by the Bank of Japan (BoJ) and the European Central Bank (ECB) warrants some caution before positioning for any meaningful corrective decline for the EUR/JPY cross. In fact, the BoJ is the only central bank in the world to maintain a negative benchmark interest rate. Furthermore, the BoJ has emphasised that a sustainable pay hike is a prerequisite to consider dismantling its massive monetary stimulus.
In contrast, the ECB has raised borrowing costs by a combined 425 bps since last July and the markets are still pricing in one more rate hike by the end of this year. This, in turn, remains supportive of elevated German bond yields, which continue to underpin the shared currency and suggests that the path of least resistance for the EUR/JPY cross is to the upside. Hence, any subsequent pullback might be seen as a buying opportunity and is likely to remain limited.
Traders might also refrain from placing aggressive bets and prefer to wait on the sidelines ahead of this week’s key data/event risks. The flash version of the Euro Zone PMI prints will be released on Wednesday and provide a fresh insight into the health of the economy. This will be followed by ECB President Christine Lagarde’s speech at the Jackson Hole Symposium on Thursday, which should help determine the next leg of a directional move for the EUR/JPY cross.
Technical Levels: Supports and Resistances
EURJPY currently trading at 159.3 at the time of writing. Pair opened at 159.32 and is trading with a change of -0.01 % .
| Overview | Overview.1 | |
|---|---|---|
| 0 | Today last price | 159.30 |
| 1 | Today Daily Change | -0.02 |
| 2 | Today Daily Change % | -0.01 |
| 3 | Today daily open | 159.32 |
The pair remains strongly bullish on the daily timeframe. It trades above its 20 SMA @ 157.24, 50 SMA 156.41, 100 SMA @ 152.29 and 200 SMA @ 147.42.
| Trends | Trends.1 | |
|---|---|---|
| 0 | Daily SMA20 | 157.24 |
| 1 | Daily SMA50 | 156.41 |
| 2 | Daily SMA100 | 152.29 |
| 3 | Daily SMA200 | 147.42 |
The previous day high was 159.4 while the previous day low was 157.8. The daily 38.2% Fib levels comes at 158.79, expected to provide support. Similarly, the daily 61.8% fib level is at 158.41, expected to provide support.
Note the levels of interest below:
- Pivot support is noted at 158.28, 157.24, 156.68
- Pivot resistance is noted at 159.88, 160.44, 161.47
| Levels | Levels.1 |
|---|---|
| Previous Daily High | 159.40 |
| Previous Daily Low | 157.80 |
| Previous Weekly High | 159.34 |
| Previous Weekly Low | 157.66 |
| Previous Monthly High | 158.05 |
| Previous Monthly Low | 151.41 |
| Daily Fibonacci 38.2% | 158.79 |
| Daily Fibonacci 61.8% | 158.41 |
| Daily Pivot Point S1 | 158.28 |
| Daily Pivot Point S2 | 157.24 |
| Daily Pivot Point S3 | 156.68 |
| Daily Pivot Point R1 | 159.88 |
| Daily Pivot Point R2 | 160.44 |
| Daily Pivot Point R3 | 161.47 |
[/s2If]
Download Nehcap EAWe have two EAs that are operational on our LIVE accounts.
- EA-FIX: Check out the details here. Download EA-FIX . EA-FIX is a non-grid HFT scalper.
- EA-GROWTH: High quality low dd EA using trend grids. Download EA_GROWTHJoin Our Telegram Group
")


